We have already published short tutorial on Windows kernel debugging with IDA and VMWare on our site, but the debugging experience can still be improved.
VMWare’s GDB stub is very basic, it doesn’t know anything about processes or threads (for Windows guests), so for anything high-level we’ll need to do some extra work. We will show how to get the loaded module list and load symbols for all them using IDAPython.
Preparing VM for debugging
Let’s assume that you already have a VM with Windows (32-bit) installed. Before starting the debugging, copy files for which you want to see symbols to the host. If you’re not sure, copy nt*.exe and hal.dll from System32, and the whole System32\drivers directory.
Edit the VM’s .vmx file to enable GDB debugger stub:
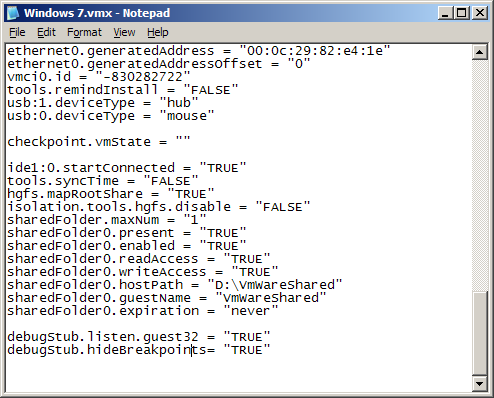
Add these lines to the file:
debugStub.listen.guest32 = "TRUE"
debugStub.hideBreakpoints= "TRUE"
Save the file.
In VMWare, click "Power on this virtual machine" or click the green Play button on the toolbar.
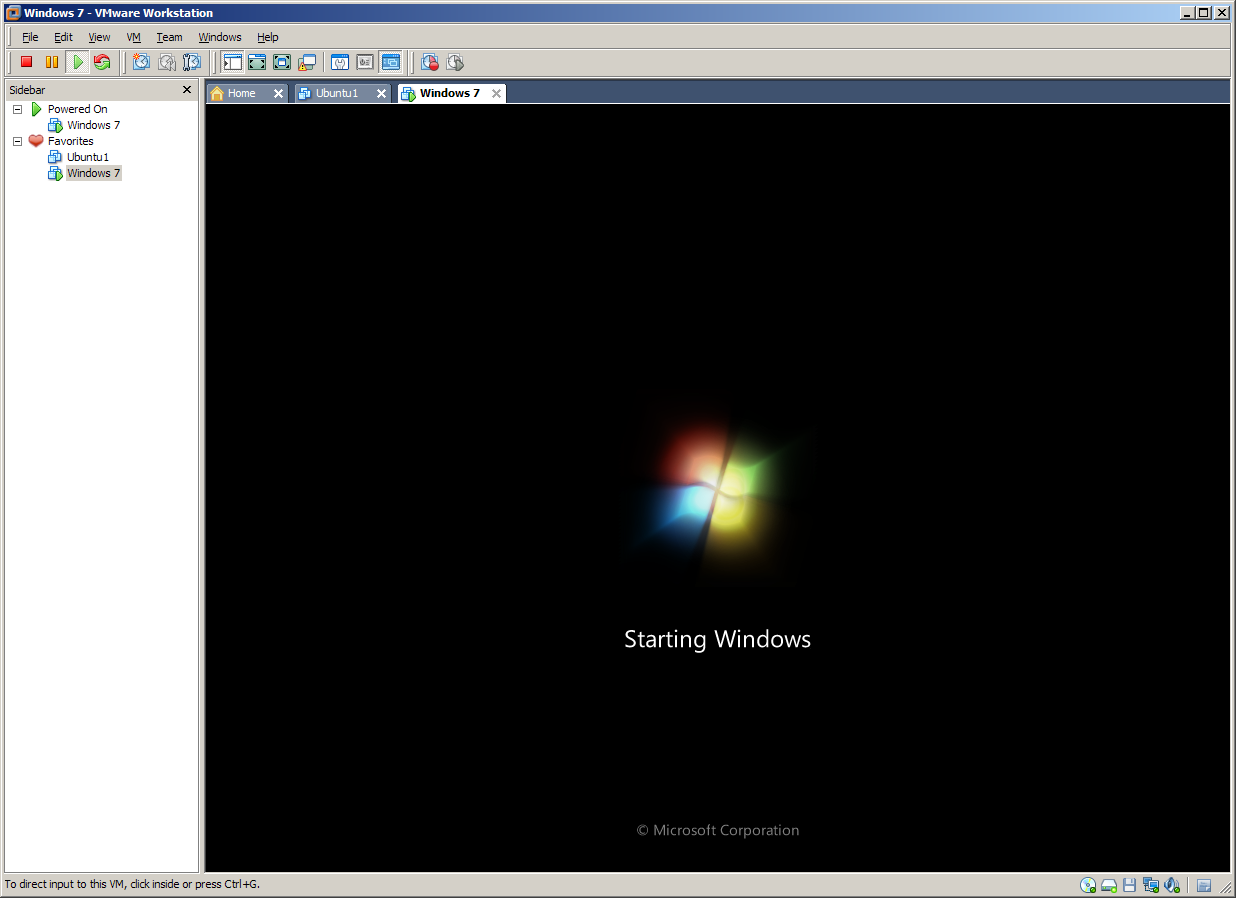
Wait until the VM boots.
Debugging in IDA
Start IDA.
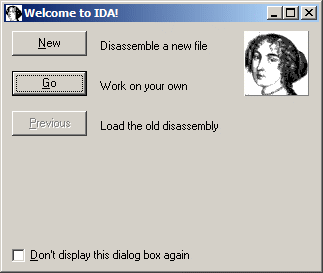
If you get the welcome dialog, choose "Go".
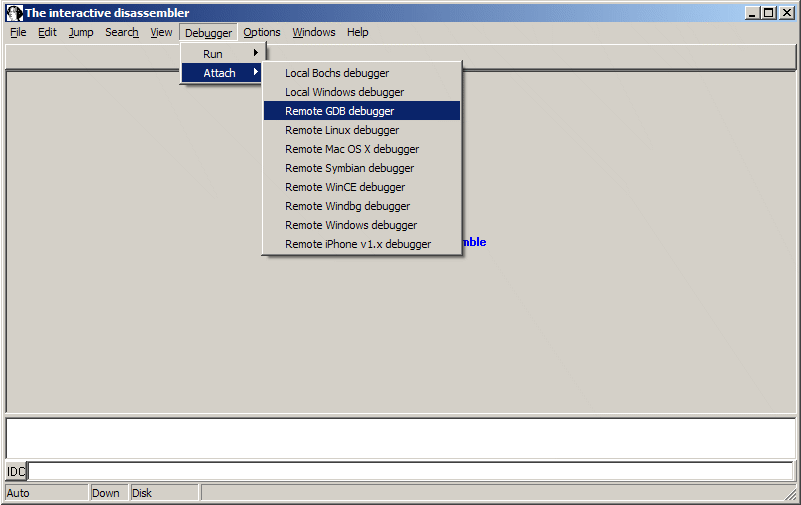
Choose Debugger | Attach | Remote GDB debugger.
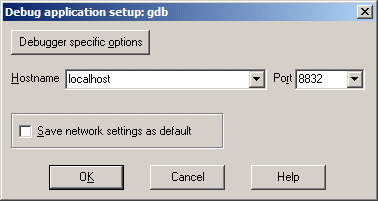
Enter "localhost" for hostname and 8832 for the port number.
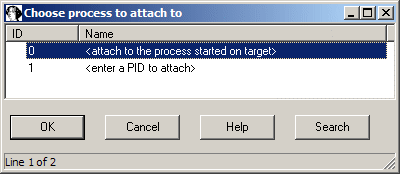
Choose <attach to the process started on target> and click OK.
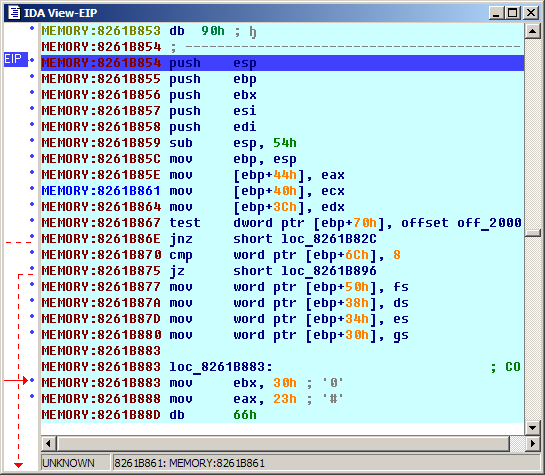
The execution should stop somewhere in the kernel (address above 0x80000000). You can step through the code, but it’s not very convenient without any names. Let’s try to gather some more information.
Getting the module list
The list of kernel modules is stored in the list pointed to by the PsLoadedModuleListsymbol in the kernel. To find its address, we will use the so-called"KPCR trick". KPCR stands for Kernel Processor Control Region. It is used by the kernel to store various information about each processor. It is placed at the base of the segment pointed to by the fsregister (similar to TEB in user mode). One of the fields in it isKdVersionBlockwhich points to a structure used by the kernel debugger. It, in turn, has various pointers to kernel structures, includingPsLoadedModuleList.
Definition of the KPCR structure can be found in many places, including IDA’s ntddk.til. Right now we just need to know that KdVersionBlockfield is situated at offset 0x34 from the start of KPCR. It points toDBGKD_GET_VERSION64, which has PsLoadedModuleListpointer at offset 0x18.
Let’s write a small Python function to find the value of that pointer. To retrieve the base of the segment pointed to by fs, we can use the VMWare’s debug monitor "r" command. GDB debugger plugin registers an IDC function SendGDBMonitor()to send commands to the monitor, and we can use IDAPython’s Eval()function to call it:
fs_str = Eval('SendGDBMonitor("r fs")')
Returned string has the following format:
fs 0x30 base 0x82744a00 limit 0x00002008 type 0x3 s 1 dpl 0 p 1 db 1
We need the address specified after"base":
kpcr = int(fs_str[13:23], 16) #extract and convert as base 16 (hexadecimal) number
Then get the value of KdVersionBlock:
kdversionblock = Dword(kpcr+0x34)
And finally PsLoadedModuleList:
PsLoadedModuleList = Dword(kdversionblock+0x18)
Walking the module list
PsLoadedModuleListis declared as PLIST_ENTRY. LIST_ENTRY is a structure which represents a member of a double-linked list:
typedef struct _LIST_ENTRY
{
     PLIST_ENTRY Flink;
     PLIST_ENTRY Blink;
} LIST_ENTRY, *PLIST_ENTRY;
So, we just need to follow the Flink pointer until we come back to where we started. A single entry of the list has the following structure:
struct LDR_MODULE
{
  LIST_ENTRY InLoadOrderModuleList;
  LIST_ENTRY InMemoryOrderModuleList;
  LIST_ENTRY InInitializationOrderModuleList;
  PVOID BaseAddress;
  PVOID EntryPoint;
  ULONG SizeOfImage;
  UNICODE_STRING FullDllName;
  UNICODE_STRING BaseDllName;
  ULONG Flags;
  SHORT LoadCount;
  SHORT TlsIndex;
  LIST_ENTRY HashTableEntry;
  ULONG TimeDateStamp;
};
Now we can write a small function to walk this list and create a segment for each module:
#get the first module
cur_mod = Dword(PsLoadedModuleList)
while cur_mod != PsLoadedModuleList and cur_mod != BADADDR:
  BaseAddress  = Dword(cur_mod+0x18)
  SizeOfImage  = Dword(cur_mod+0x20)
  FullDllName  = get_unistr(cur_mod+0x24)
  BaseDllName  = get_unistr(cur_mod+0x2C)
  #create a segment for the module
  SegCreate(BaseAddress, BaseAddress+SizeOfImage, 0, 1, saRelByte, scPriv)
  #set its name
  SegRename(BaseAddress, BaseDllName)
  #get next entry
  cur_mod = Dword(cur_mod)
Loading symbols
Having the module list is nice, but not very useful without symbols. We can load the symbols manually for each module using File | Load File | PDB file… command, but it would be better to automate it.
For that we can use the PDB plugin. From looking at its sources (available in the SDK), we can see that it supports three "call codes":
//call_code==0: user invoked 'load pdb' command, load pdb for the input file
//call_code==1: ida decided to call the plugin itself
//call_code==2: load pdb for an additional exe/dll
//              load_addr: netnode("$ pdb").altval(0)
//              dll_name:  netnode("$ pdb").supstr(0)
Call code 2 looks just like what we need. However, current IDAPython includes a rather basic implementation of netnode class and it is not possible to set supvals from Python. However, if we look at handling of the other call codes, we can see that the plugin retrieves module base from "$ PE header" netnode and module path using get_input_file_path() function. IDAPython’snetnode.altset() function does work, and we can use set_root_filename() to set the input file path. Also, if we pass a call code 3, we will avoid the "Do you want to load the symbols?" prompt.
#new netnode instance
penode = idaapi.netnode()
#create netnode the in database if necessary
penode.create("$PE header")
#set the imagebase (-2 == 0xFFFFFFFE)
penode.altset(0xFFFFFFFE, BaseAddress)
#set the module filename
idaapi.set_root_filename(filename)
#run the plugin
RunPlugin("pdb",3)
However, we need to replace the kernel-mode path by the local path beforehand:
#path to the local copy of System32 directory
local_sys32 = r"D:\VmWareShared\w7\System32"
if FullDllName.lower().startswith(r"\systemroot\system32"):
#translate into local filename
filename = local_sys32 + FullDllName[20:]
Now we can gather all pieces into a single script.
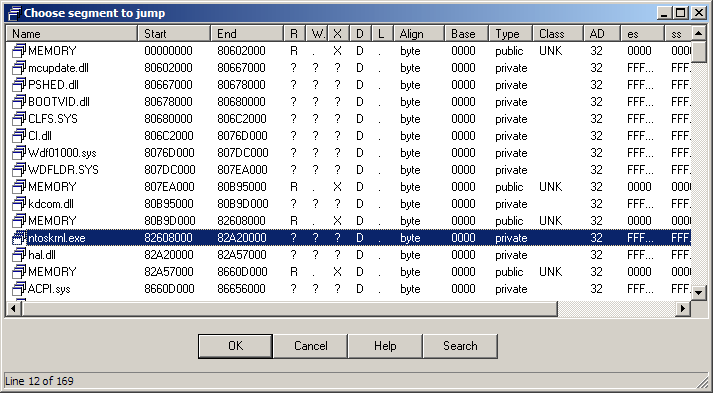
After running it, you should have a nice memory map:
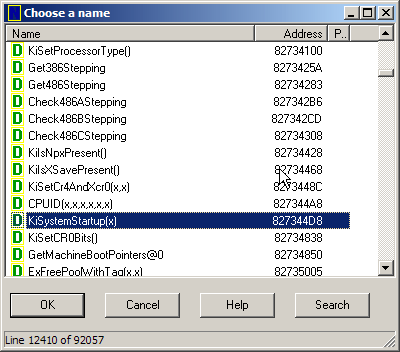
…and name list:
Looks much better now. Happy debugging!