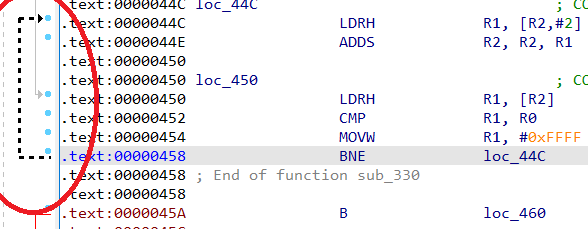
Although nowadays most IDA users probably use the graph view, the text view can still be useful in certain situations. In case you haven’t noticed, it has a UI element which can help you visualize code flow even without the full graph and even outside of functions (the graph view is available only for functions). This element is shown on the left of the disassembly listing:

The arrows represent code flow (cross-references) and the following types may be present:
- Solid lines represent unconditional jumps/branches, dashed lines – conditional ones;
- Thick arrows are used for jumps back to lower addresses (they indicate potential loops);
- The current arrow is highlighted in black;
- Red arrows are used when target and/or destination lies outside of the function boundaries
In addition to arrows, the blue dots indicate potential breakpoint location, so the breakpoint can be added by clicking on the dot, which will highlight the whole line red to indicate an active breakpoint.


