This is a guest entry written by Simon Garrelou and Sylvain Peyrefitte from the Airbus CERT Team. Their views and opinions are their own and not those of Hex-Rays. Any technical or maintenance issues regarding the code herein should be directed to the authors.
Power up your debugging with time travel: the ttddbg plugin
Time Travel Debugging is an innovative way of debugging programs by recording their state at every step of the execution, allowing analysts to move freely around the execution timeline. Several time-travelling debuggers already exist for a variety of programming languages, but most of them require access to the source code of the program being analyzed.
WinDbg's TTD feature is different: it works at the lowest possible level, recording the execution of a program opcode by opcode. This means that it can be used on programs for which we do not have access to the source code, such as malware samples.
ttddbg brings the power of Microsoft WinDbg's Time-Travel Debugging to IDA. Using the native TTD API, reverse engineered by commial, we were able to interface directly with WinDbg's TTD libraries and load trace files. This was then used to create a brand new debugger plugin, integrating it in IDA directly. Using ttddbg, you can navigate WinDbg TTD trace files in IDA, integrating all your reverse engineering work such as recovered structs, function and variable names, etc.
Using ttddbg
ttddbg relies on the TTD API exposed by WinDbg Preview, which is contained in two Dynamic Link Libraries (DLL). For legal reasons, we cannot directly distribute these files. However, we have automated the process of getting a copy of these DLLs as much as possible: you only need to install WinDbg Preview from the Microsoft Store yourself. Installing ttddbg is made easy by using our automated installer. Simply click Next until it's done! The installer will automatically copy the required DLLs from WinDbg's installation folder.
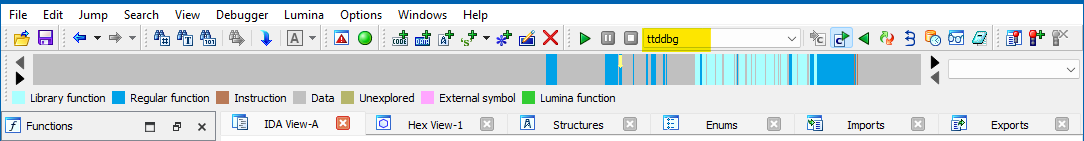
The next time you launch IDA, you should see a new debugger appearing in the usual place called "ttddbg". Starting a debugging session with this debugger requires a trace file, which can be generated from WinDbg. Change the path to the "Application" to your trace file, and carry on with the debugging.
From there, you can debug like you usually do: step through the execution, set breakpoints, observe the memory…but you can also use some new features from the debugging toolbar:
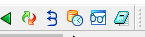
Backwards steps
The first and third icons are similar to the well-known "Continue" and "Step into" icons, albeit reversed. They will allow you to rewind execution backwards until you hit a breakpoint, or to go back in the execution flow instruction by instruction.
The second icon allows you to perform a full run of the application, from start to finish.
Combined with the regular stepping features, this allows you to move through the execution trace using well-known tools. And when you encounter an interesting part, you can save its context by using the Timeline feature.
Timeline
The third icon opens up the "Timeline" window, which records points in time that you might find interesting. By default, it is populated with every module load and thread creation event which happened during the process life.
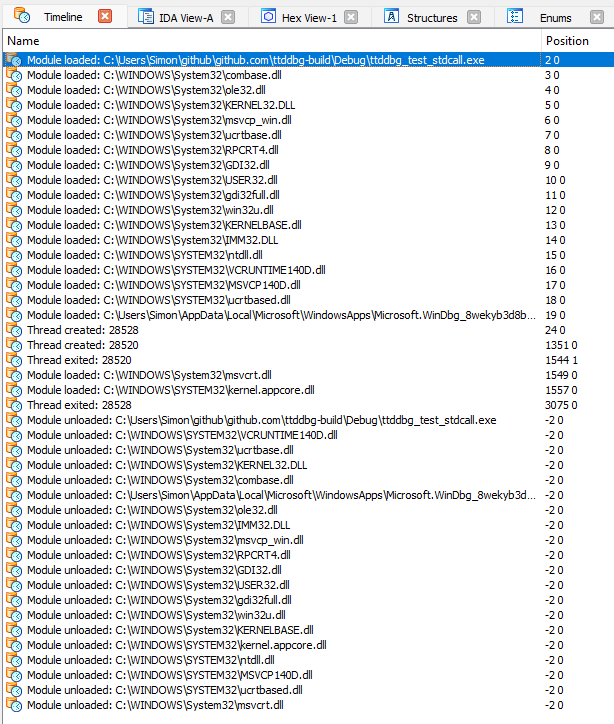
You can freely edit this list with the "Delete" and "Insert" keys. It is also saved into the IDB: if you share it with someone else (or if you use IDA Teams), your colleagues can see the results of your analysis right away.
Double-clicking on a timeline entry will jump straight to this time point in the debugger.
Function tracing
The last two icons are part of our latest feature: function tracing. You can mark functions to be traced by the TTD engine by right-clicking on a function in the dedicated window (Shift-F3). All currently traced functions can be seen in the "Function tracing" window.
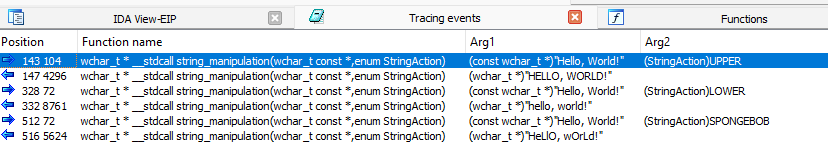
Any time the engine encounters a "call" instruction pointing towards a traced function, it will be recorded by ttddbg. We also automatically extract the arguments to the function, and use the type information from IDA to pretty-print the result if possible.
When a "ret" instruction happens in a traced function, it is also recorded, and its return value as well.
All trace events can be seen using the "Tracing events" window. From there, you can also copy the address to every function call argument, which allows you to go directly to it in memory if you wish.
Keep in mind
While it can be very useful, ttddbg has a few limitations to keep in mind:
- There is no guarantee on Microsoft's side that the TTD API will remain stable. An update to WinDbg might totally break the interoperability one day.
- Even when inside the debugger, you are not actually executing any of the code. While this is a good thing from a security point of view, it also means that you cannot change the state of the program like you could with a real debugger (i.e. changing conditional jumps, patching bytes, etc.)