One of the new features that will be available in the next version of IDA is a trace re-player. This pseudo-debugger allows to re-play execution traces of programs debugged in IDA. The replayer debugger allows replaying traces recorded with any of the currently supported debuggers, ranging from local Linux or win32 debuggers to remote GDB targets. Currently supported targets include x86, x86_64, ARM, MIPS and PPC.
When we are re-playing a recorded trace, we can step forward and backward, set breakpoints, inspect register values, change the instruction pointer to any recorded IP, etc…
Also, trace management capabilities have been added to IDA in order to allow saving and loading recorded execution traces. Let’s see an example.
A vulnerable sample program
For this blog post, I will show you how this plugin can be used to analyze a bug in a toy executable program. This sample application receives 2 arguments: a message to display and the size of it. The program checks if the size of the given buffer (calling strlen) is longer than the size specified, printing out an error message and exiting. If not, memory of the given size is reserved for a local variable, the contents of the buffer copied to it and a message based on this string printed out to stdout. After this, the memory reserved is freed and the application simply exits.
In this application there is a little integer overflow bug that can be triggered giving to the size argument a negative value. Let’s record a trace of the program crashing and replay it in IDA to understand why the program is crashing:
- Set a breakpoint in the entry point.
- Set the program arguments to “whatever -1” in Debugger → Process options.
- Run the application with the correspondent debugger (in my case, the “Local Linux” debugger).
- When the breakpoint is reached, enable instruction tracing (via the menu item “Debugger → Tracing → Instruction tracing”).
- Let the application continue (press F9).
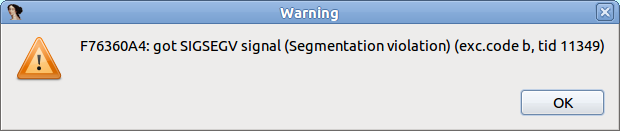
At some point it will crash with a message similar to this:
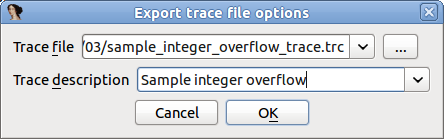
When the application crashes, stop the debugger, go to the trace window (Debugger → Tracing → Trace window) and save the trace to a file (right click on the window and, from the pop-up menu, select the option Other options → Save binary trace file to disk). Specify the file name and a description for this trace and click OK:
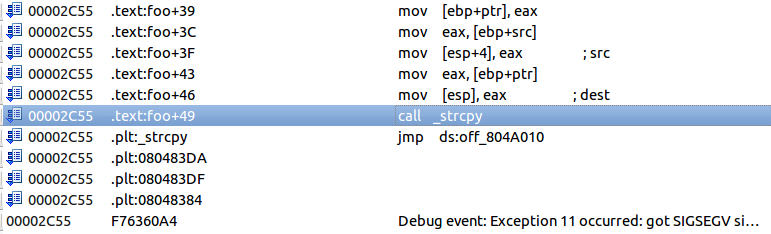
Next, switch to the “Trace replayer debugger” (from the menu Debugger → Switch to debugger, and then select “Trace replayer”). After this, go to the trace window to see where is it crashing and set a breakpoint in the function call that segfaults. In our example, it’s crashing in a call to strcpy in function “foo” as we may see here:
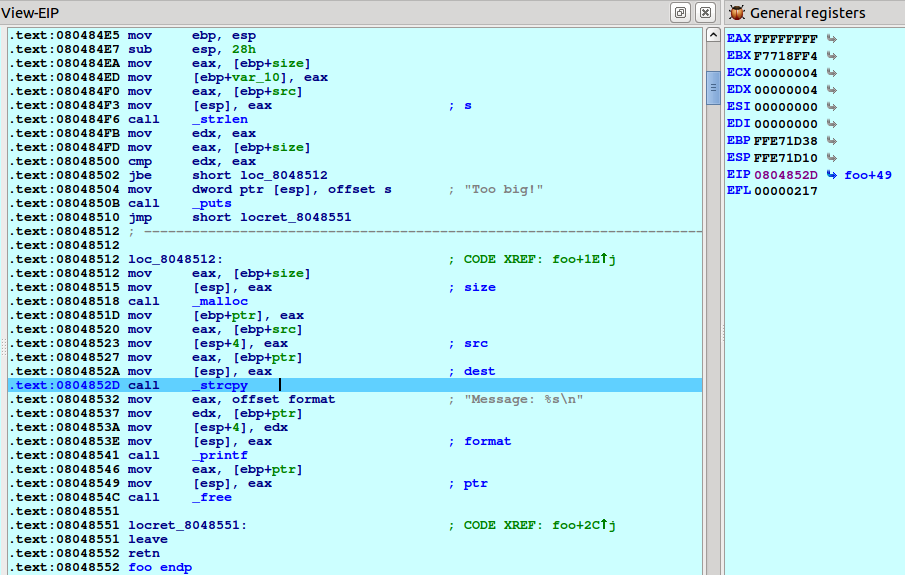
We will set a breakpoint in the call to strcpy in function “foo” and press F9 to replay the trace. When the breakpoint is reached we have all the register values as they were when the program was really executed (click to enlarge):
There is a check at 0x08048502 for the size of the given buffer and the size given in the command line. As -1 is lower than strlen(“AAAA”) the developer didn’t expected the program to reach the basic block where the malloc and strcpy calls are made. There is another bug here: before the call to strcpy there is a call to malloc to reserve memory with the size we gave in the command line, but the developer didn’t performed any check to see if the memory was correctly reserved or not. Let’s step back to this position by selecting from the menu Debugger → Step back. Click this menu item various times until EIP points to 0x804851D. Alternatively, at the IDC prompt in the bottom part of IDA, we may enter the command “StepBack()” and press enter. No matter how we moved to the instruction after the malloc call, we will see the following in IDA:
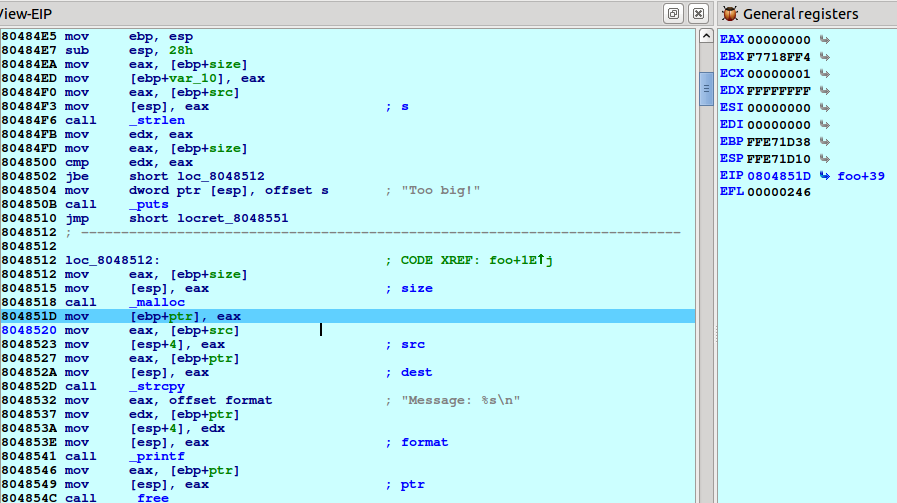
The program failed to reserve memory as the returned pointer is NULL. Step back until the “call _malloc” instruction to see the size passed to malloc:
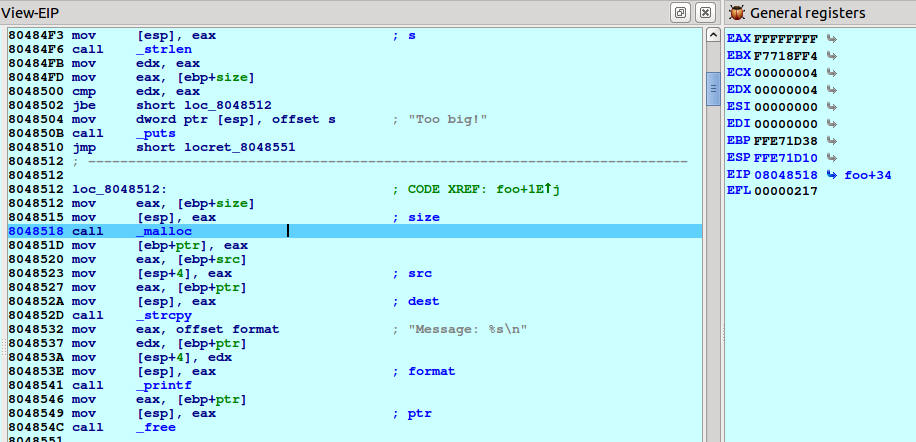
The program is trying to reserve 0xFFFFFFFF bytes (4 GB) and it fails to do so. Let’s analyse how the program reached the point where the memory is reserved, the strcpy call is performed, etc… when it wasn’t supposed to do so. Click on the 1st instruction of the function “foo”, right click and select from the pop-up menu “Set IP” (this way, we are telling the re-player to change IP to the nearest event with this IP). The instruction pointer and all the other register values changes:
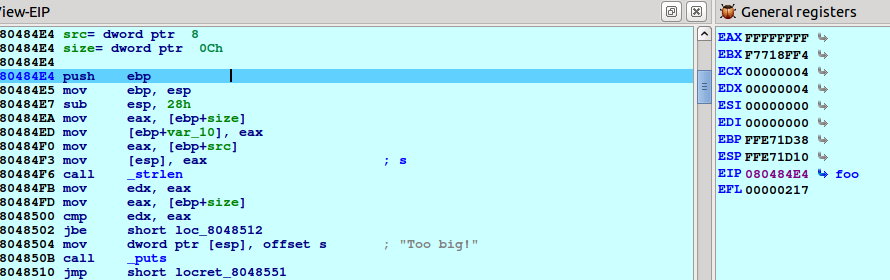
Now, step over the instructions until we reach the JBE one (alternatively, we could simply right click in the JBE instruction and select from the pop-up menu “Set IP”). Once moved to this instruction, we will see the following register values:
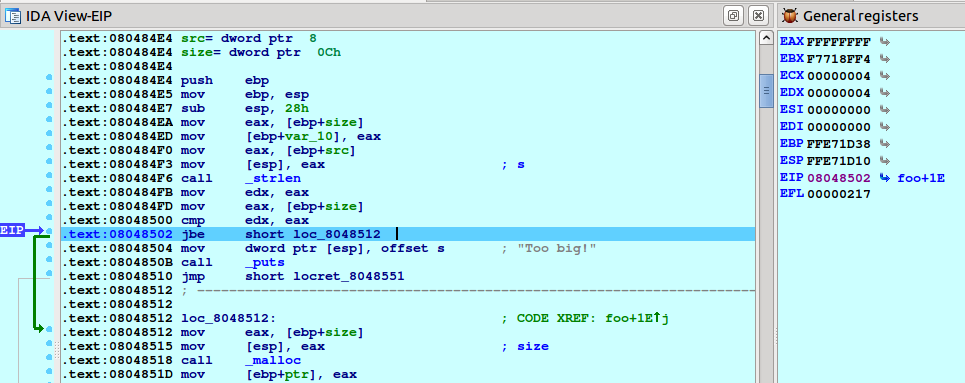
The result of the call to strlen passing the given buffer (unsigned) is compared against the size value we gave in the command line (which is calculated as atoi(argv[2]), which returns a signed integer). Then, an unsigned comparison (JBE) is performed and the check “0x4 <= 0xFFFFFFFF” passes. Now you can document this bug and continue searching for more or fix it and recompile your application.
We hope you like this new IDA feature!