Sometimes we want to perform the coverage analysis of the input file: to find areas of the program not exercised by a set of test cases. These test cases may come from a test suit or you could be trying to to find a vulnerability in the program by ‘fuzzing’ it. A nice feedback in the form of a list of ‘not-yet-executed’ instructions would be a nice addition to blind fuzzing.
The straightforward way of creating such an analyzer in IDA would be to use the built-it instruction tracer. It would work for small (toy-size) programs but would be too slow for real-world programs. Besides, multi-threaded applications can not be handled by the tracer.
To tell the truth, we do not really need to trace every single instruction. Noting that the instruction at the beginning of a basic block gets executed would be enough. (A basic block is a sequence of instructions without any jumps into the middle). Thanks to the cross-reference and name information in IDA, we can discover them quite reliably, especially in the compiler generated code.
So, a more clever approach would be to set a breakpoint at the beginning of each basic block. We would keep a breakpoint at place until it fires. As soon the breakpoint gets triggered, we remove it and let the program continue. This gives us tremendous speed boost, but the speed is still not acceptable. Since an average program contains many thousands basic blocks, just setting or removing breakpoints for them is too slow, especially over a network link (for remote debugging).
To make the analyzer to work even faster, we have to abandon IDA-controlled breakpoints and handle them ourselves. It seems difficult and laborious. In practice, it turns out to be very easy. Since we do not have ‘real’ breakpoints that have to be kept intact after firing, the logic becomes very simple (note that the most difficult part of breakpoint handling is resuming the program execution after it: you have to remove the breakpoint, single step, put the breakpoint back and resume the execution – and the debugged program can return something unexpected at any time, like an event from another thread or another exception). Here is the logic for simple one-shot breakpoints:
if we get a software breakpoint exception and it’s address is in the breakpoint list
then
remove the breakpoint by restoring the original program byte
update EIP with the exception address
resume the program execution
endif
This algorithm requires 2 arrays: the breakpoint list and the original program bytes. The breakpoint list can be kept as vector<bool>, i.e. one bit per address.
Anyway, enough details. Here are some pictures.
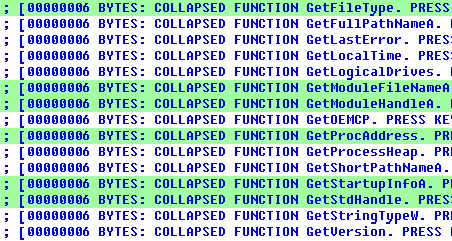
This view of the imported function thunks gives as live view of executed functions from Windows API (green means executed):

If you continue to run the program, more and more lines will be painted green.
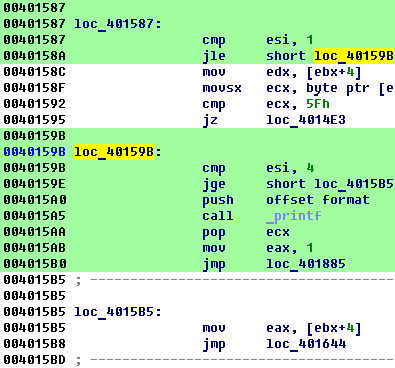
In the following picture we see what instructions were executed and what were not:

We see that the jump at 40158A was taken and therefore ESI was always 1 or less.
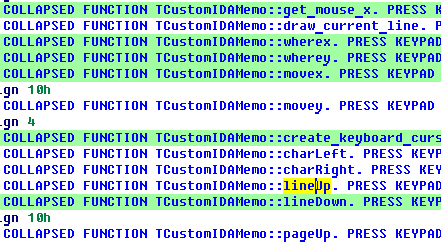
If we collapse all functions of the program (View, Hide all), then this ‘bird eye’ view will tell us about the executed functions

The last picture was taken while running IDA in IDA itself. We see the names of user-interface functions. It is obvious that I pressed the Down key but haven’t tried to press the Up/Left/Right keys yet. I see how the plugin can be useful for in-house IDA testing…
Here is the plugin: /ida_pro/files/coverit.zip
As usual, it comes with the source code. IDA v5.0 is required to run it.
There are many possible improvements for it:
- Track function execution instead of basic block execution.
- Create a nice list of executed/not-executed functions.
- Create something like a navigation band to display the results (in fact it is not very difficult, just create a window and draw on it pixel by pixel or, rather, rectangle by rectangle)
- Count the number of executions. Currently the plugin detects only the fact of the instruction execution but does not count how many times it gets executed. Counting will slow things down but I’m sure that it can still be made acceptably fast.
- Monitor several segments/dlls at once. The current version handles only the first code segment coming from the input file (so called loader segment). It can be made to monitor the whole memory process excluding the windows kernel code that handles exceptions.
- Port to other platforms and processors. For the moment the code is MS Windows-oriented (the exception and breakpoint codes are hardcoded). Seems to be easy.
- Make the plugin to remember the basic block list between runs. This will improve the startup speed of subsequent runs.
- Add customization dialog box (the color, function/bb selector), in short, everything said above can be parameterized.
This plugin demonstrates how to do some tricky things in IDA: how to refresh the screen only when it is really necessary, to hook low-level debugger functions, to find basic blocks, etc.
Have fun and nice coverage!