We are happy to introduce the Malware Analysis Add-on for IDA Pro!
This suite supercharges the triage of a large volume of malware, such as seen by SOC, IR, and threat intelligence teams. The Add-on extends IDA to address many phases of malware analysis, including unpacking and deobfuscation, emulation, and decryption/decoding of data. You’ll spend less time wading through tedious tasks and more time focused on the relevant code. Ultimately, this product is derived from real-world experience defending against targeted malware and relevant to cyber defense organizations worldwide.
We know that analysts usually open IDA because of how well it disassembles and decompiles. But IDA is a general tool, and malware analysis has many slow manual steps: identify the packer, unwrap the inner payload, configure a safe dynamic analysis environment (physical hardware? VirtualBox with snapshots?), and correlate sandbox results with the decompiler. The Add-on does all these steps for you, so you can find the code that matters and understand what it does.
In the following reverse engineering scenarios, we’ll show you (and your agents) how to use the Add-on to:
- remove repetitive unpacking steps on typical malware,
- step through confusing code safely, with no VM to set up, and
- hyperlink sandbox events directly into the disassembly/pseudocode views.
Many teams keep their own scripts for these tasks, and the logic decays when their owner leaves. Hex-Rays maintains the Add-on, so you can report bugs and get updates. We have a lot of additional features lined up and currently undergoing testing, including a dedicated deobfuscator to deal with control flow flattening and opaque predicates.
The Malware Analysis Add-on is available now with IDA 9.5. You can purchase it directly from our webshop or by contacting sales@hex-rays.com. To celebrate the launch, we’re offering 50% off the Add-on until December 31, 2026 with the promo code MALADD50.
Key Features
The Malware Analysis Add-on bundles a wide array of features for malware analysis. While many of the techniques are well understood, we’ve spent a lot of effort to make them work out of the box. For example, we’ve packaged full-system Windows emulators so you can trivially and safely step through code you don’t understand. The sample cannot escape or damage data, and you do not need a VM or a remote debugger. Step, set breakpoints, and stop or restart with IDA's traditional debugger controls. Now it's even simpler to step through the construction of a stack string, either as a human or an AI agent.
These emulators serve as a foundation for other parts of the Malware Analysis Add-on, including the unpacking and deobfuscation of malware. The automated unpacker is highly configurable, providing different heuristics that operate over a variety of backends: remote physical hardware, virtual machine snapshots, and emulators. While the true debugger backends are most correct and bypass more environmental gating checks, the full system emulators are extremely easy to set up and safe to run locally. Therefore, our “sane defaults” make it painless and safe to unpack many malware samples. While you can always do these things by hand, or tweak the configuration values, the defaults should work for many cases.
Likewise, the Malware Analysis Add-on helps you focus on the code that matters. We integrate with services like VirusTotal, MalwareBazaar, and VMRay to give you a heads up if there already exists reporting on your sample. And with a sandbox detonation, the Add-on overlays dynamic analysis events, like API calls and memory allocation, directly onto the disassembly and pseudocode views. IDA highlights the instructions that are executed, showing you code coverage. The trace view shows the API calls and their arguments, and lets you jump directly to the instruction that made each call. You can also import memory regions from the run, such as shellcode and injected payloads.
Case Study: Unpacking Malware
Let’s start by considering the file NSModule.exe that you might see attached to a SOC alert. The entropy of the file is 7.96, and loading this file into IDA gives us a fairly sad view:
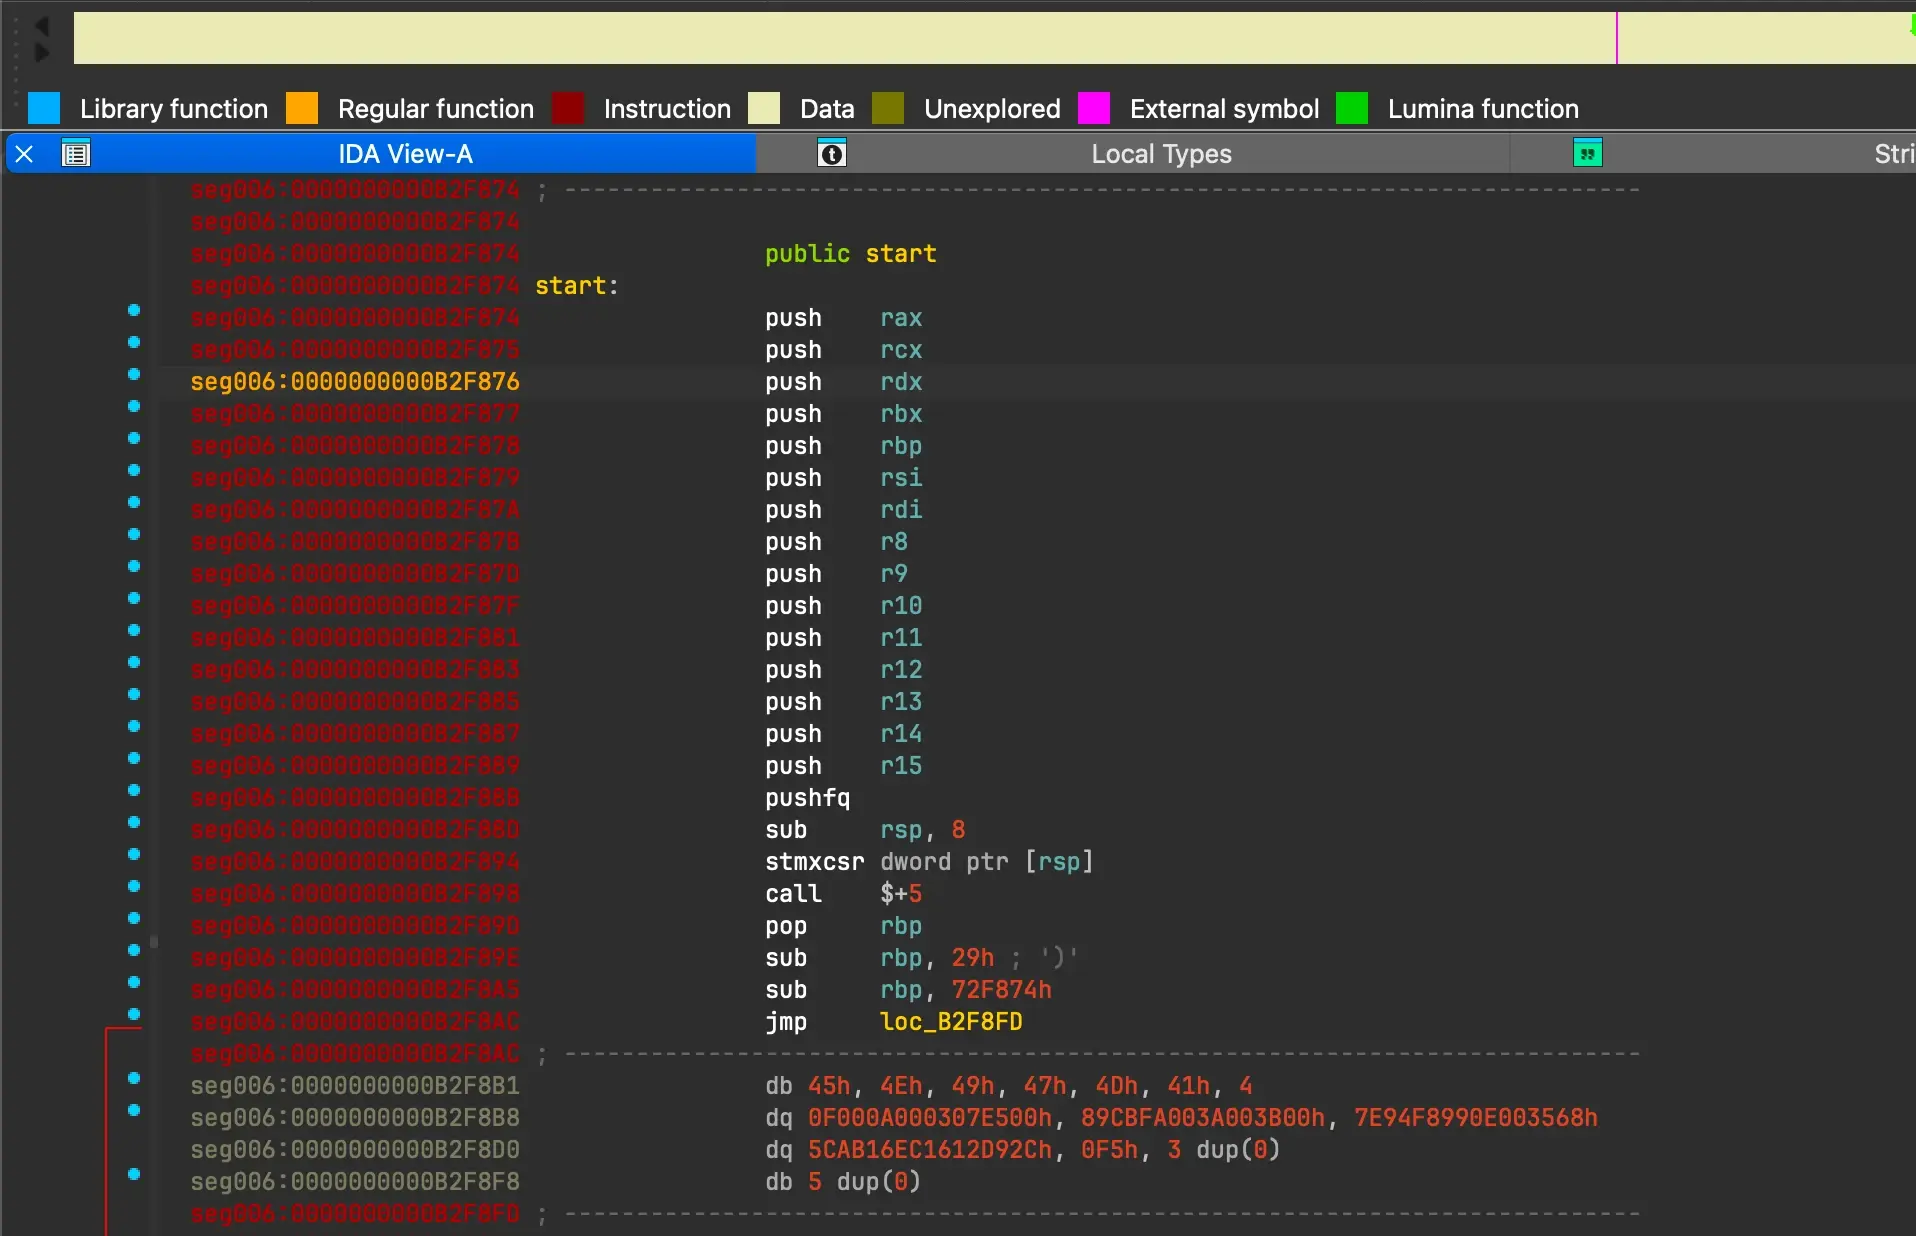
The entry point function is broken (the line prefix is red), and the overview map shows mostly “data” (lots of tan across the top of the view). All these points strongly suggest that the file is packed: the code is compressed and/or encrypted on disk.
The import table is likewise suspiciously bare:
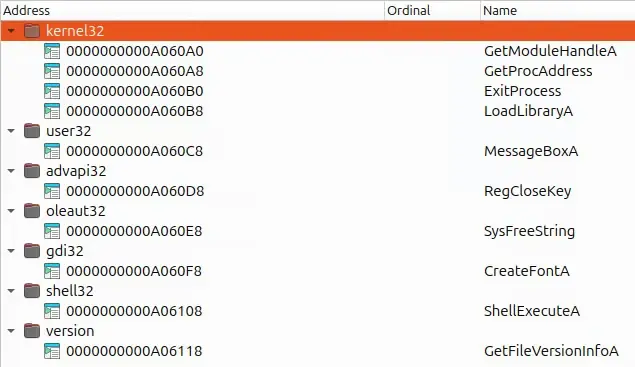
In order to manually unpack this sample, we’d probably debug it in a safe environment. This usually involves single-stepping through code, setting breakpoints on interesting routines, and/or taking memory snapshots at important moments. Beyond the inner payload’s code, we'd have to rebuild the import table so that we can understand calls to Windows API functions. It's very feasible, but often tedious.
With the Malware Analysis Add-on, IDA will automatically recognize that the sample is packed, offer to unpack it, and update your database with the inner payload transparently.
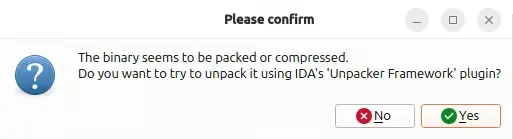
First, upon load, IDA will prompt you if you want to unpack the sample. Of course, you can always say “no” and study the decompression techniques yourself. But in the common case, pressing “yes” gets you to the inner logic faster.
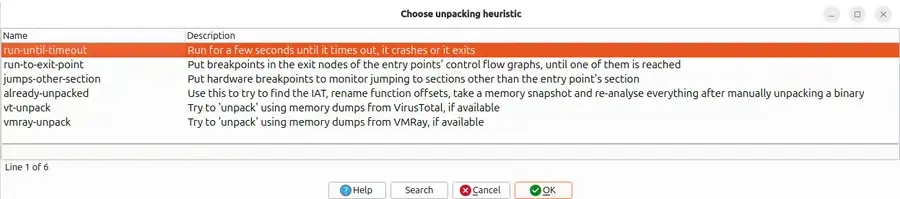
Next, you’ll be presented with a number of techniques that you can use to unpack. For example, to run for a period of time and then assume things are unpacked, or to wait for program exit and then take a snapshot.
After you make your decision, IDA will emulate or debug the program in order to unpack it. We find that debugging using remote physical hardware or with a dedicated virtual machine works most correctly, but takes a lot of time to configure safely and maintain. Therefore, we provide and recommend using emulators such as Bochs, Sogen, and Speakeasy when possible. These are very easy to configure and protect your environment from damage.
Over the next few seconds, you’ll see messages in the output window that demonstrate good progress:
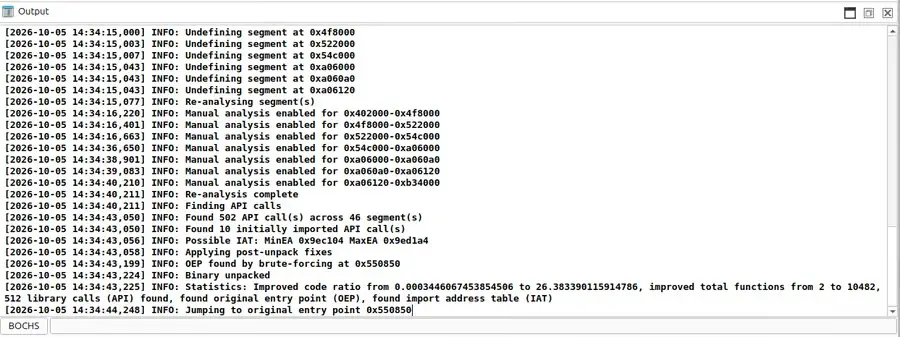
IDA emulated the sample, noticed when it had unpacked itself, and began to fix up the IDB. This included:
- importing/rewriting seven memory regions,
- rebuilding the IAT from hundreds of references to Windows API functions, and
- finding the “original entry point” (OEP).
It's a lot of tedious work. Of course, all things you probably already know how to do, but it is usually annoying to do by hand. The upshot is that IDA quickly shows us a nicely reconstructed program:
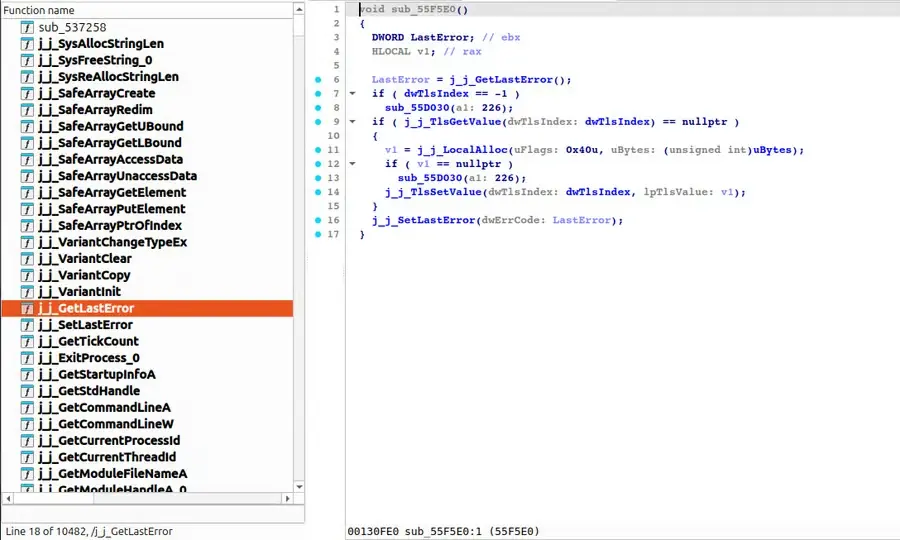
Notably, code flow and decompilation works great, ten thousand functions are visible, and FLIRT signatures have been re-applied to recognize statically linked code. Now we can turn our attention to the inner payload’s logic. Our job is much easier!
Next, let's turn our attention to a malware ecosystem that spans many layers and cannot be solved by a single unpacking phase.
Case Study: Triaging APT41’s PLUSDROP Loader
Consider the infection chain described by Google’s Threat Intelligence Group in their post “Mark Your Calendar: APT41 Innovative Tactics”: PLUSDROP is a DLL that decrypts and executes the next stage in memory. Then PLUSINJECT launches and performs process hollowing on a legitimate “svchost.exe” process, injecting the final payload. TOUGHPROGRESS executes actions on the compromised Windows host and uses Google Calendar for C2.
Reconstructing and understanding this chain is challenging: payloads are only uncovered at runtime, and a typical sandbox report is light on details. For example, consider how VMRay enumerates the host behavior:
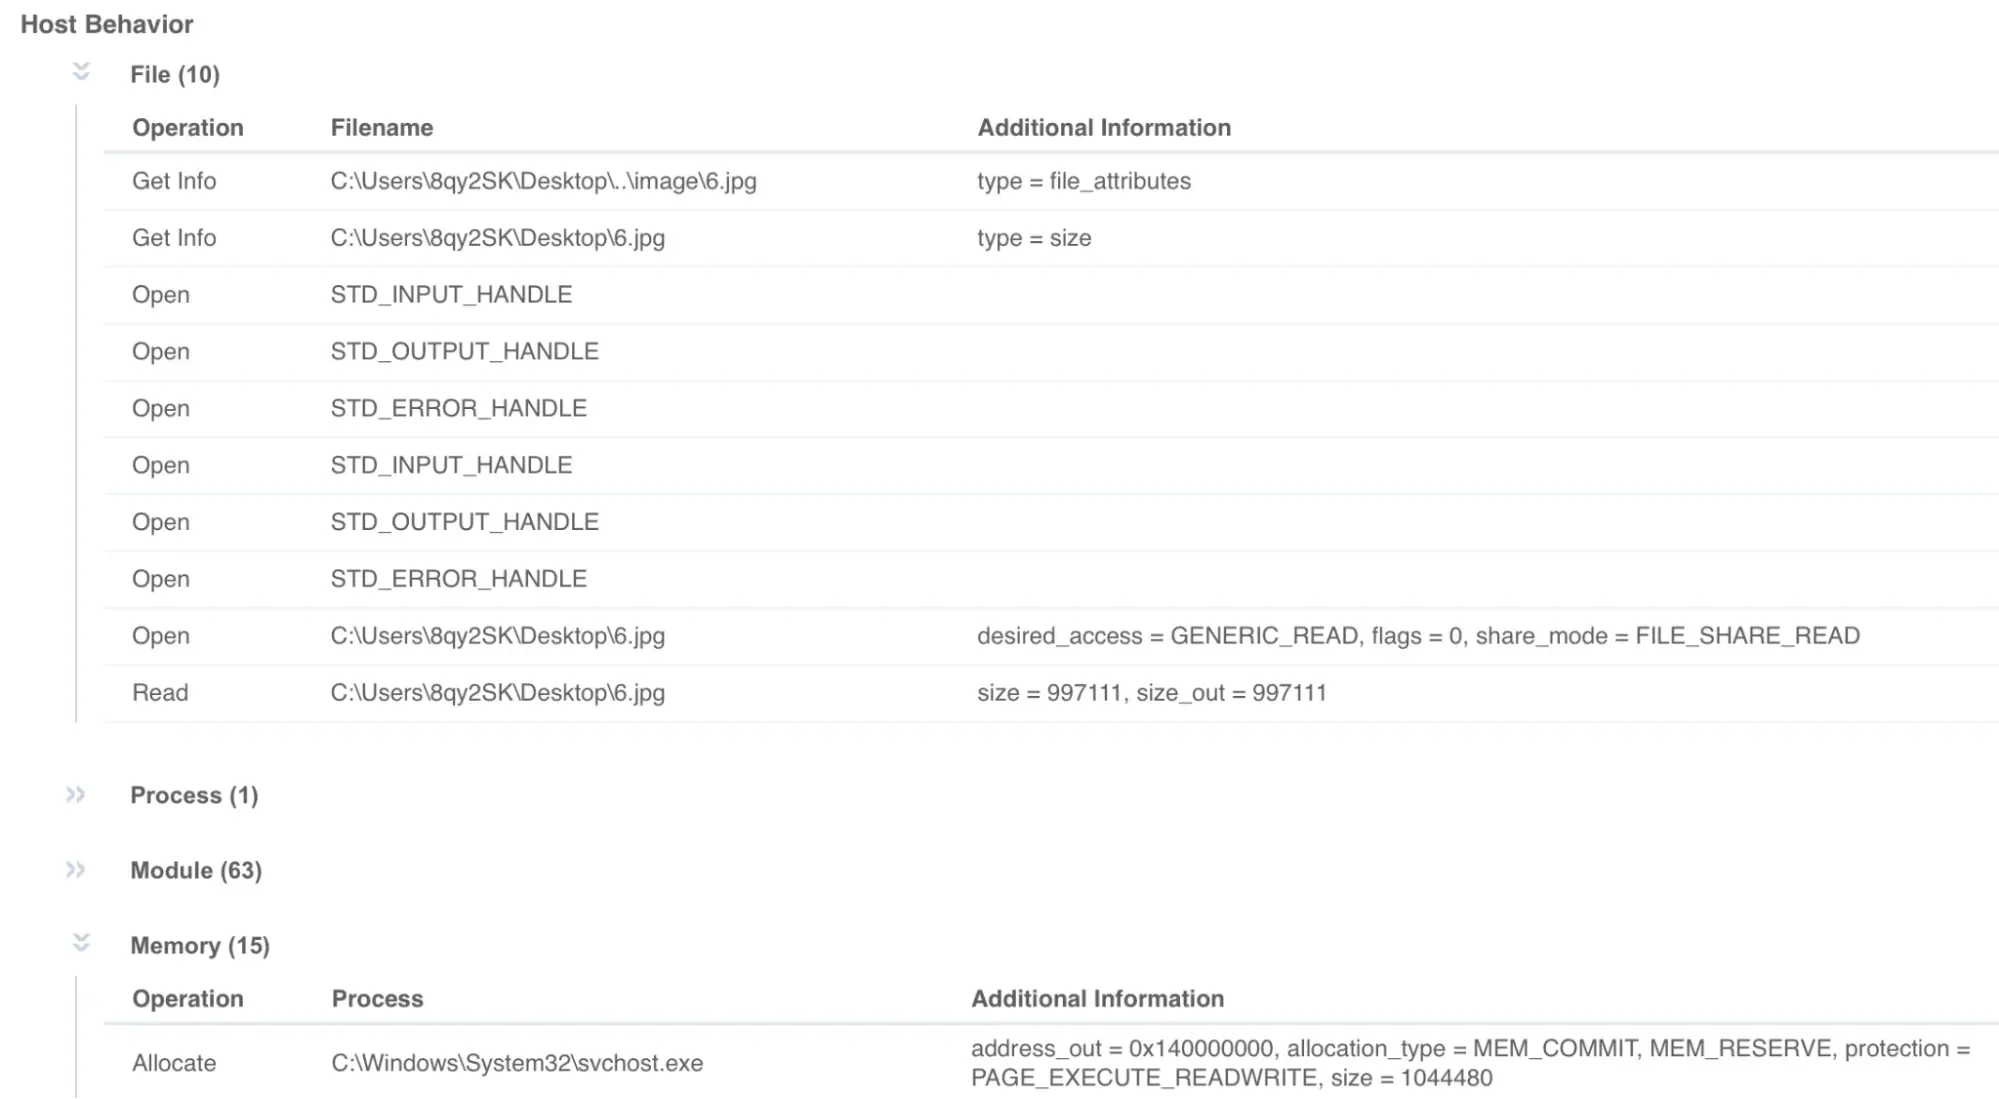
It records the file path 6.jpg, good, a Host-Based Indicator of Compromise (HBI, IOC). But it doesn’t give any insight into the purpose of the file: is it a marker of infection? Part of the decoy? An encrypted payload? Ultimately, can you confidently use it to flag a system for investigation? Not yet. Further malware analysis is needed.
So let's overlay a sandbox trace on top of IDA’s code views. If you have access to VMRay, the Malware Analysis Add-on can pull the analysis archive directly from VMRay’s API and load it alongside the disassembly view in IDA. Or, you can use Speakeasy, an open source Windows emulator written in Python, to analyze the program and capture code coverage and API call traces.
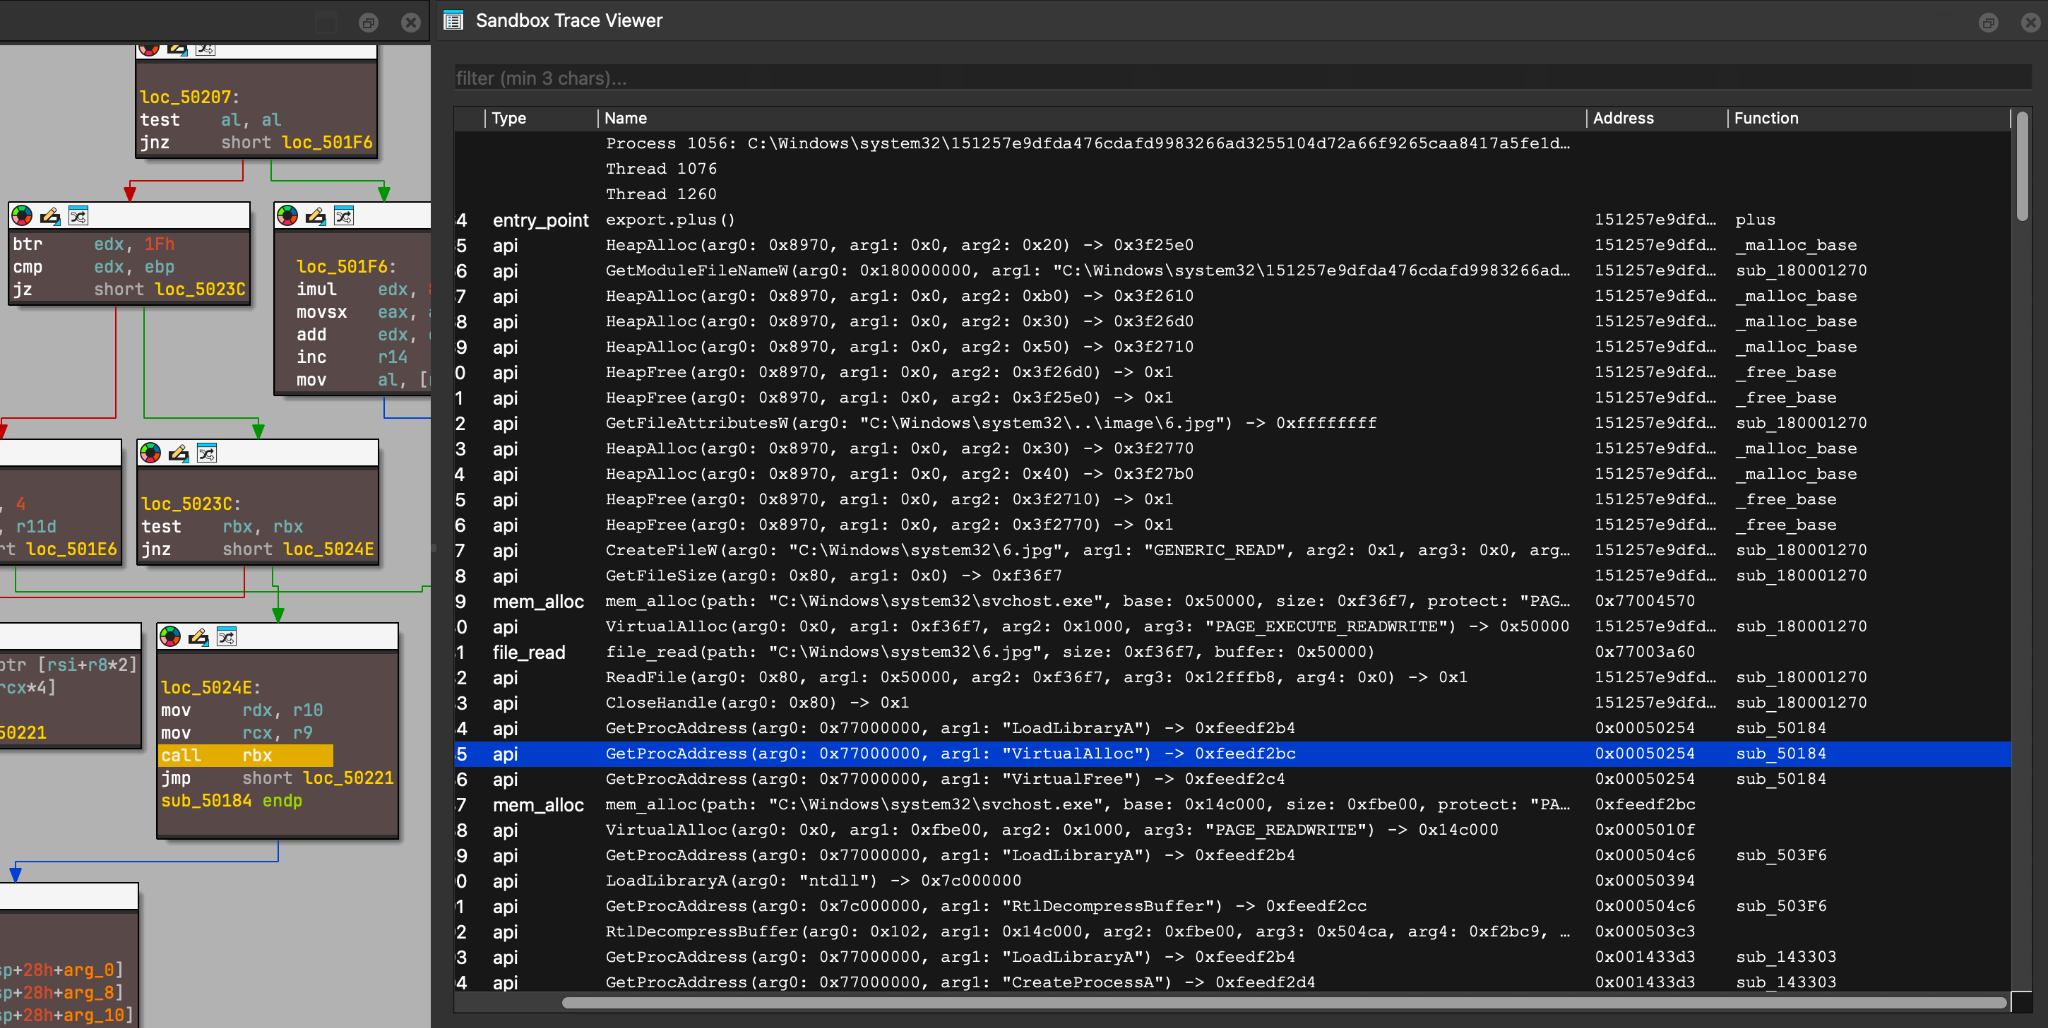
We can find the relevant code trivially: do a full-text search across the API trace to highlight the calls referencing the 6.jpg file. The table shows us a time ordered list of:
- rendered API calls, with parameters and return values, and
- their location within IDA, including addresses and symbol names.
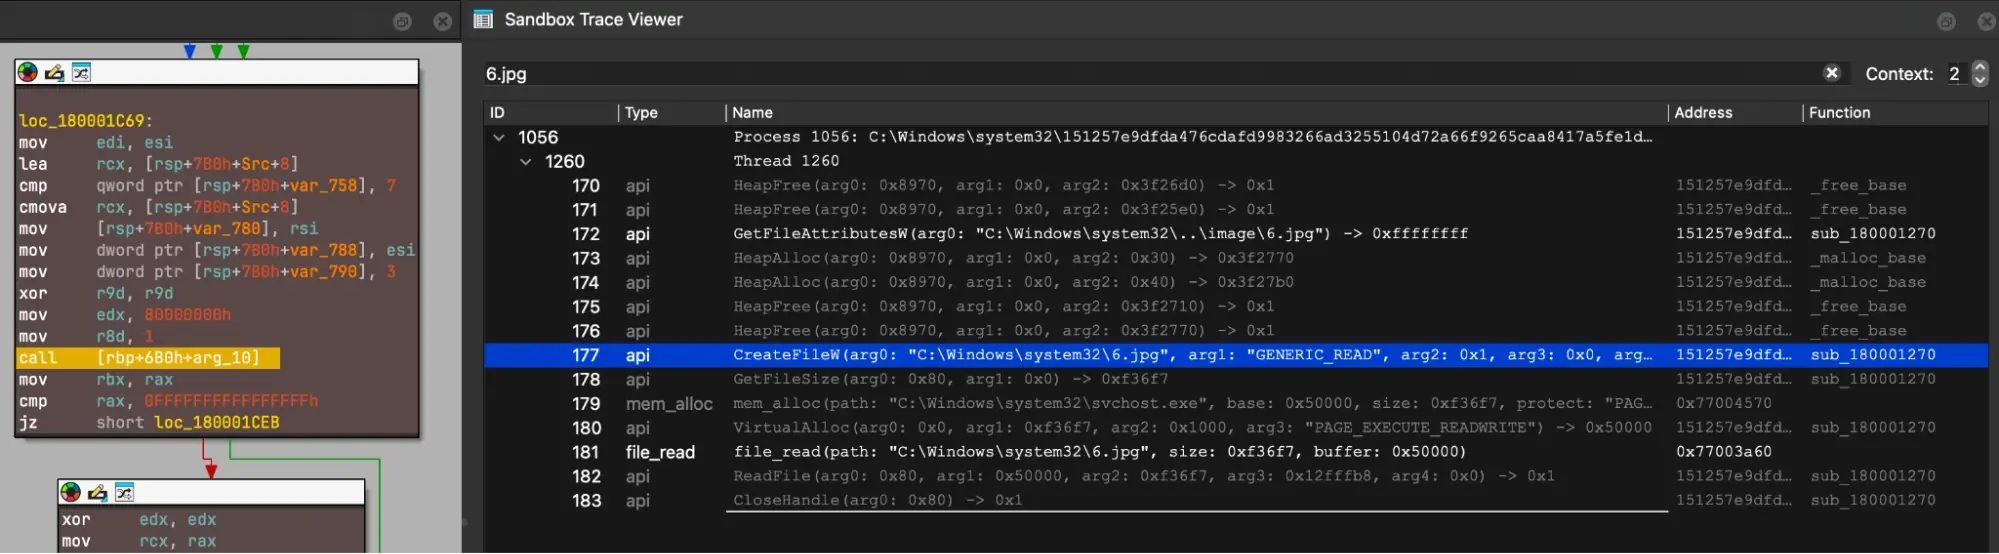
If we double click a row, we jump directly to the event’s address in the disassembly/pseudocode listing. So, we can quickly find the crucial logic within the loader.
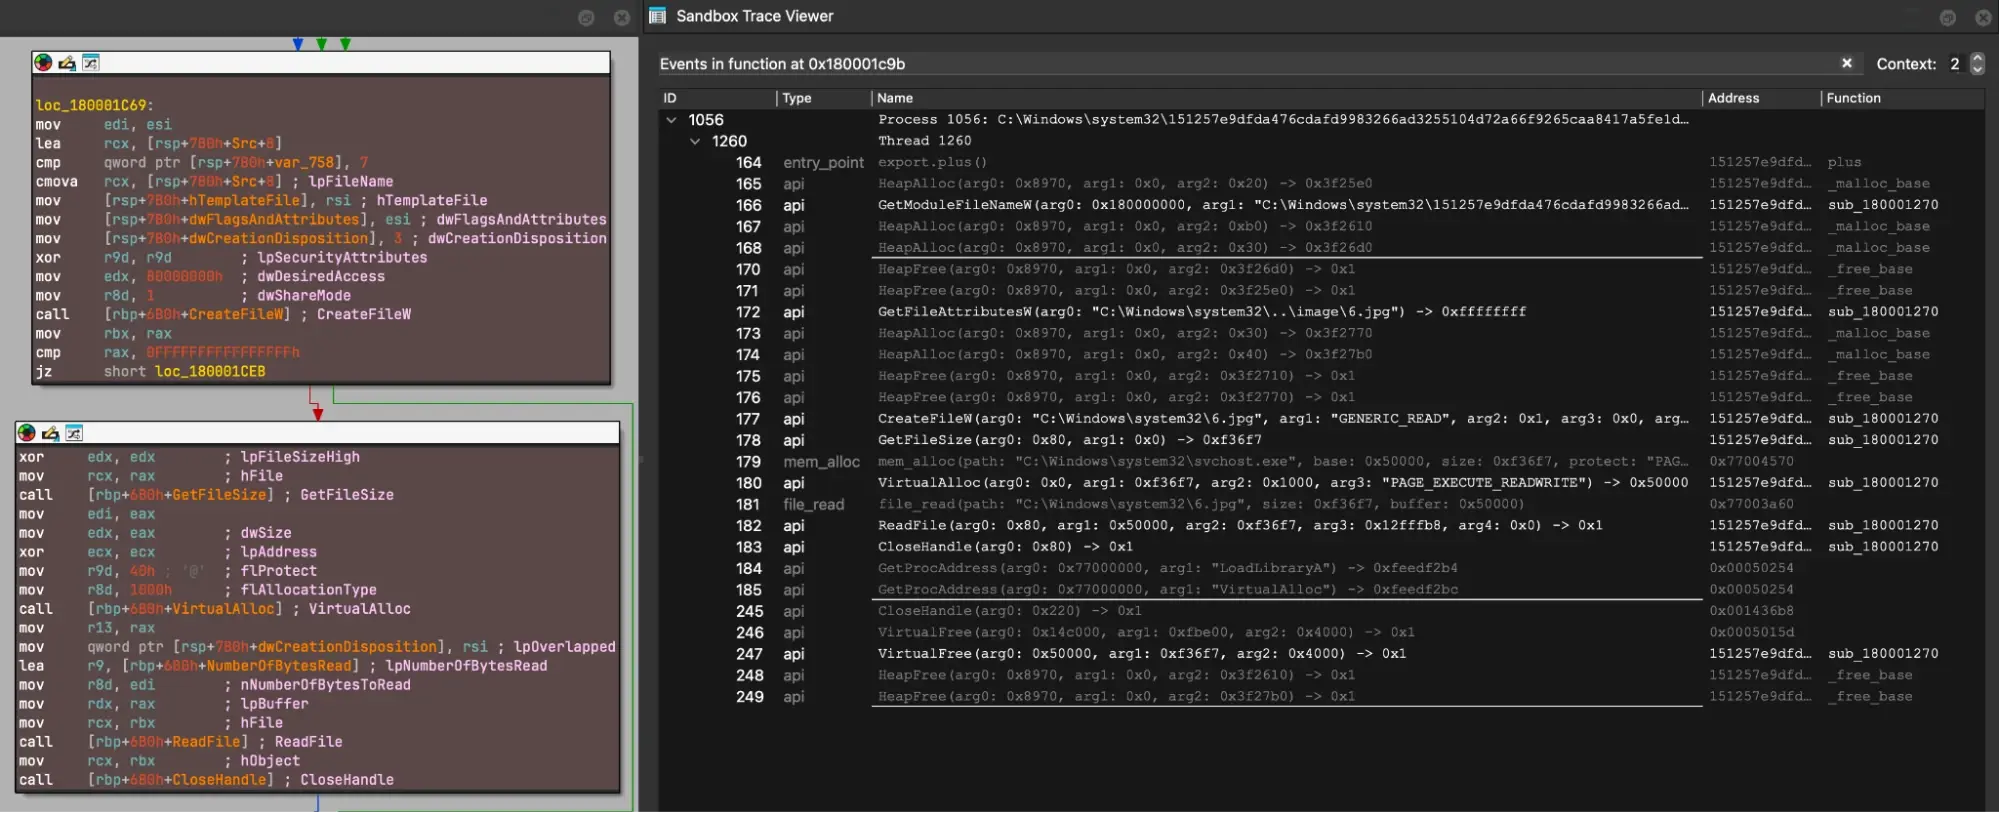
Once we’re at the call to CreateFileW, we can use the context menu action “Sandbox > Select events in this function” to find all the relevant rows from this interesting function:
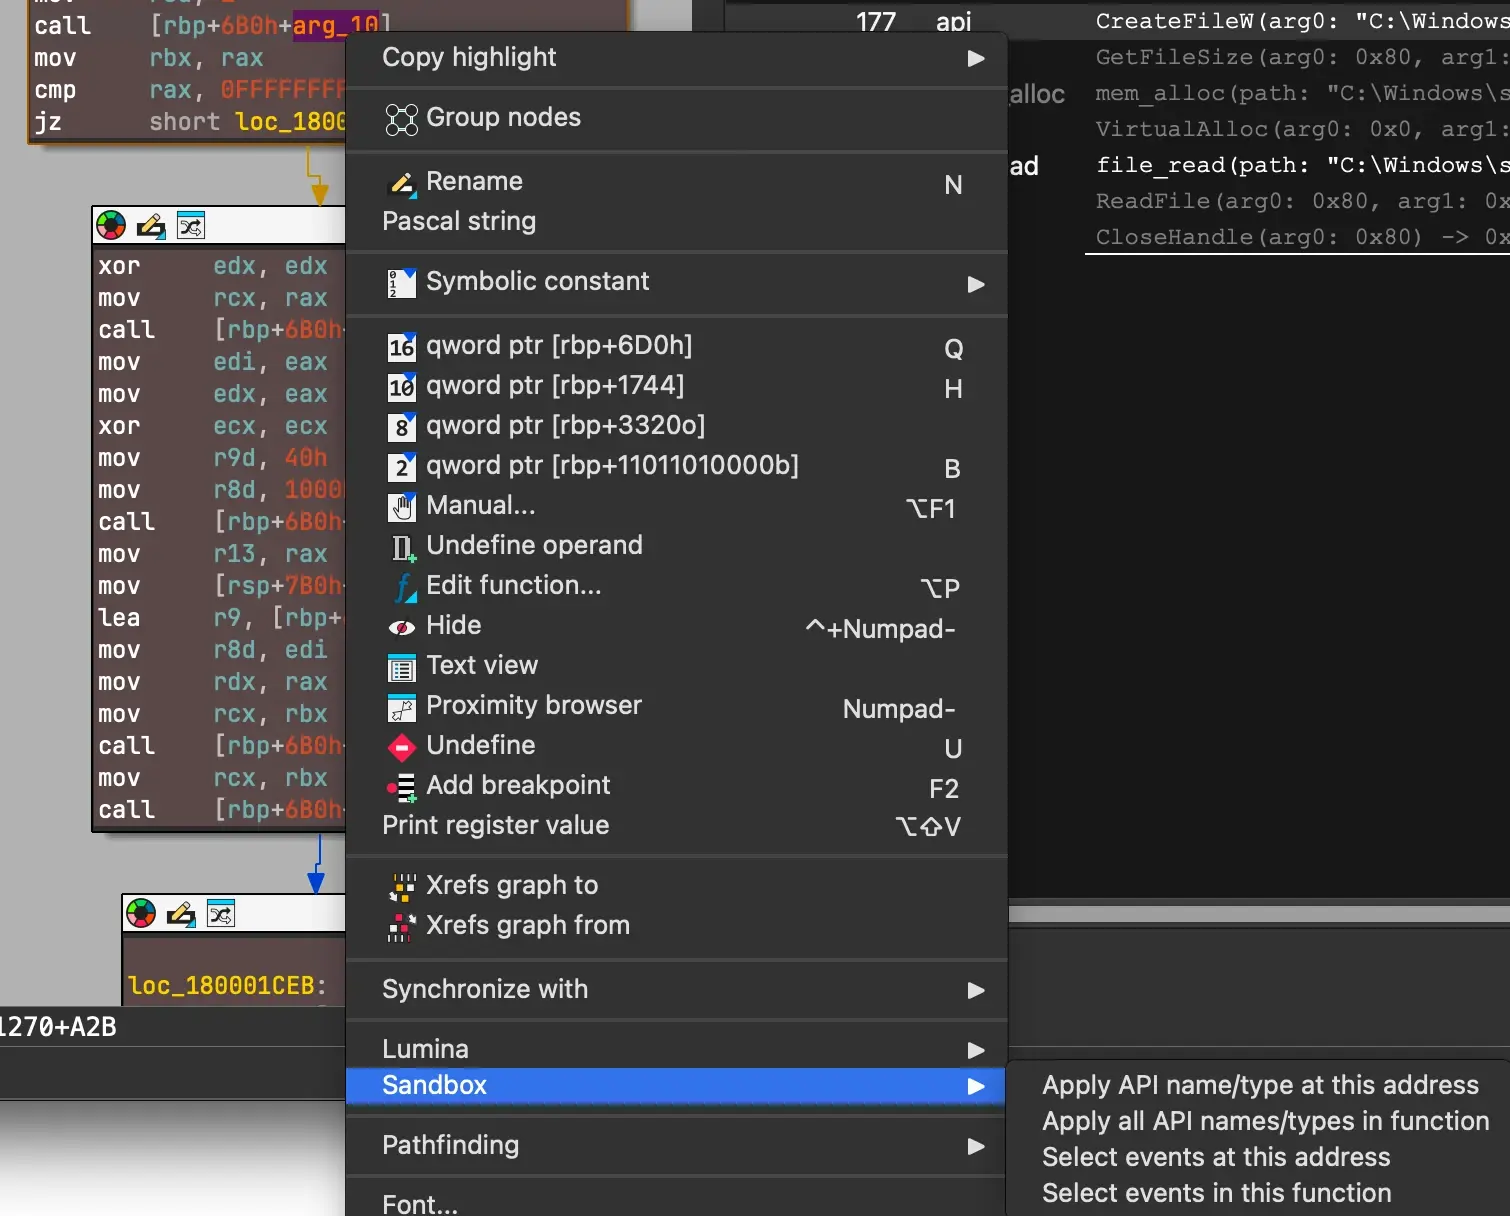
This gives us a view like:
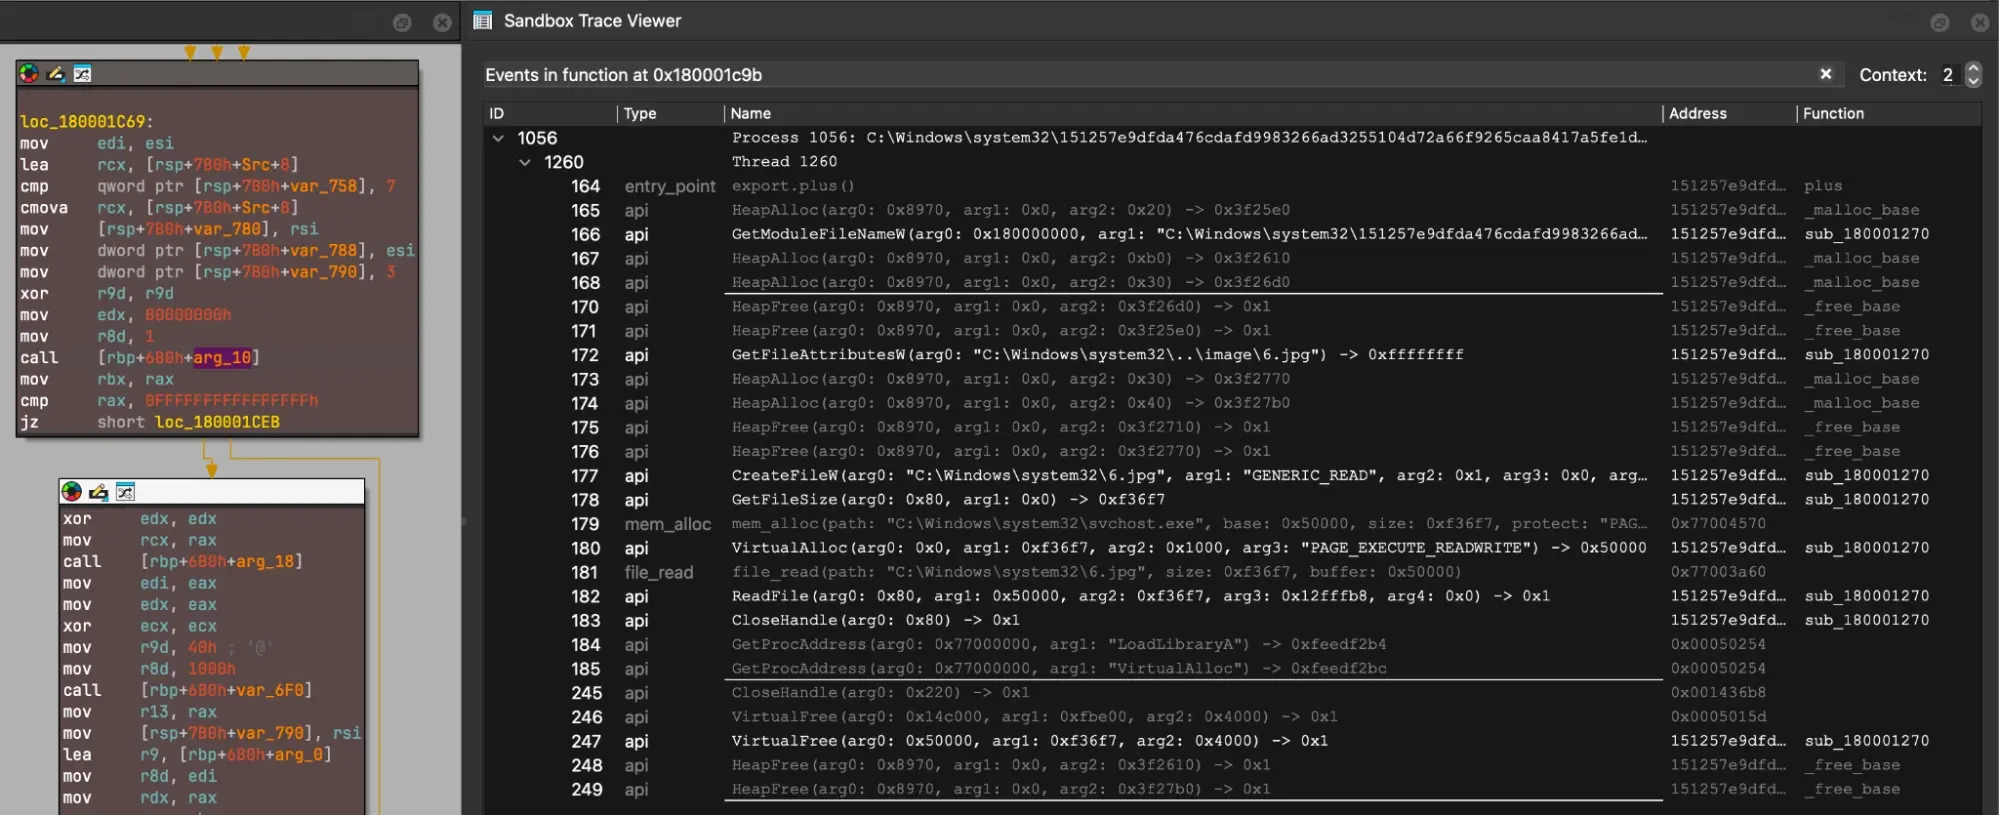
Highlighted rows are events found at addresses within this function’s bounds, while the muted lines are events from callees, such as when this function invoked subroutines, behavior happened, and control returned to our target function. This is a really powerful way to visualize the relationship between the linear disassembly and the call stack encountered at runtime.
Unfortunately when we look closely at the call instructions, they’re indirect via local variables, so their target is difficult to interpret. Usually we’d have to resolve the function pointers just like the loader does: by brute forcing hardcoded hash values to API names, or using a debugger to recover the values from runtime. But since we have the sandbox trace, we can resolve indirect calls with the context menu action: “Apply all API names/types in function”.
The Add-on applies names, parameters, and types to the disassembly view, as well as the pseudocode view:
|
Before: 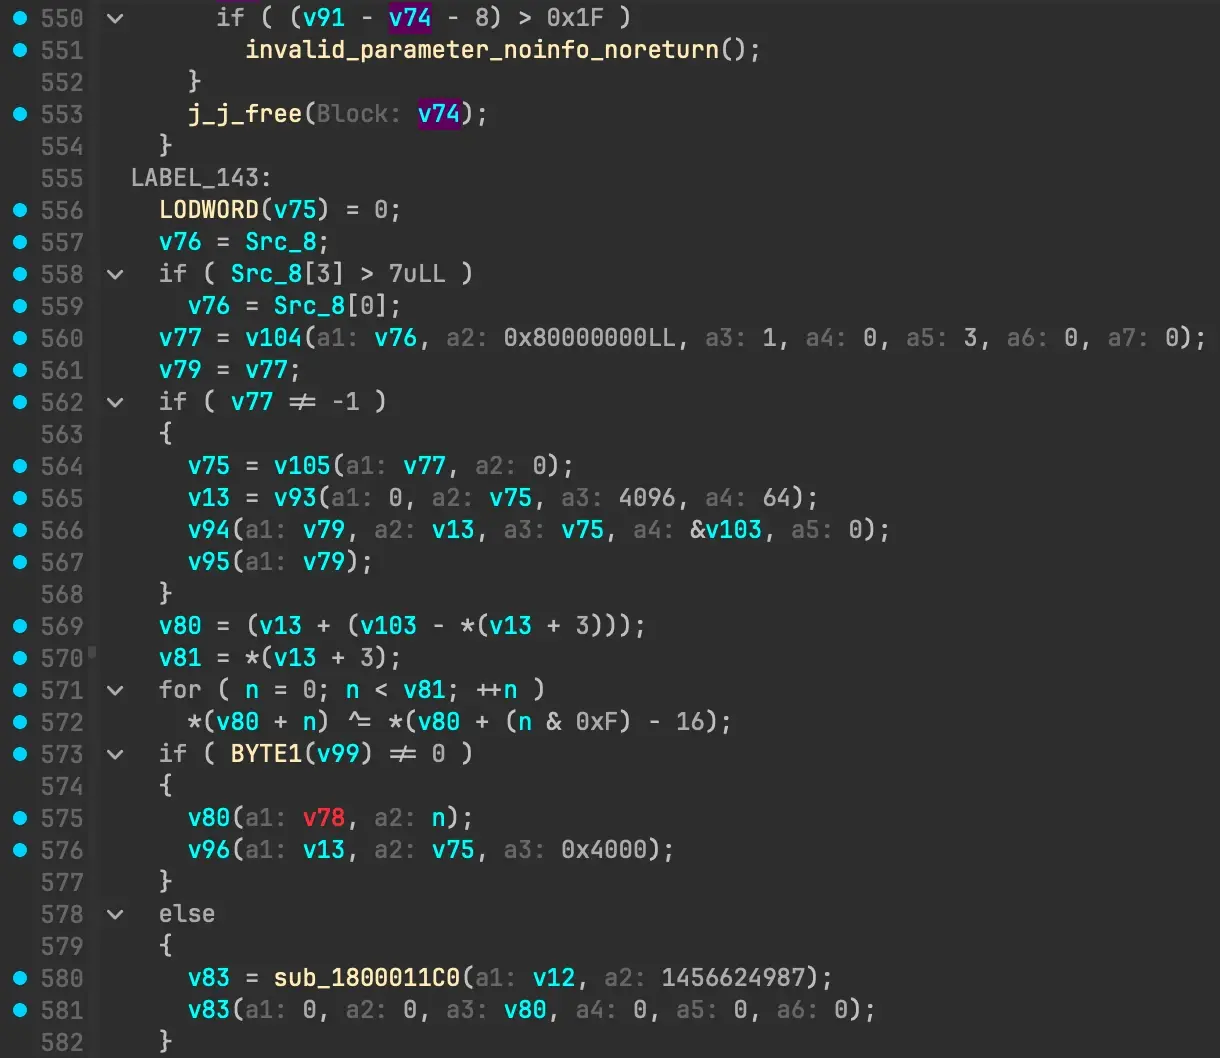 |
After: 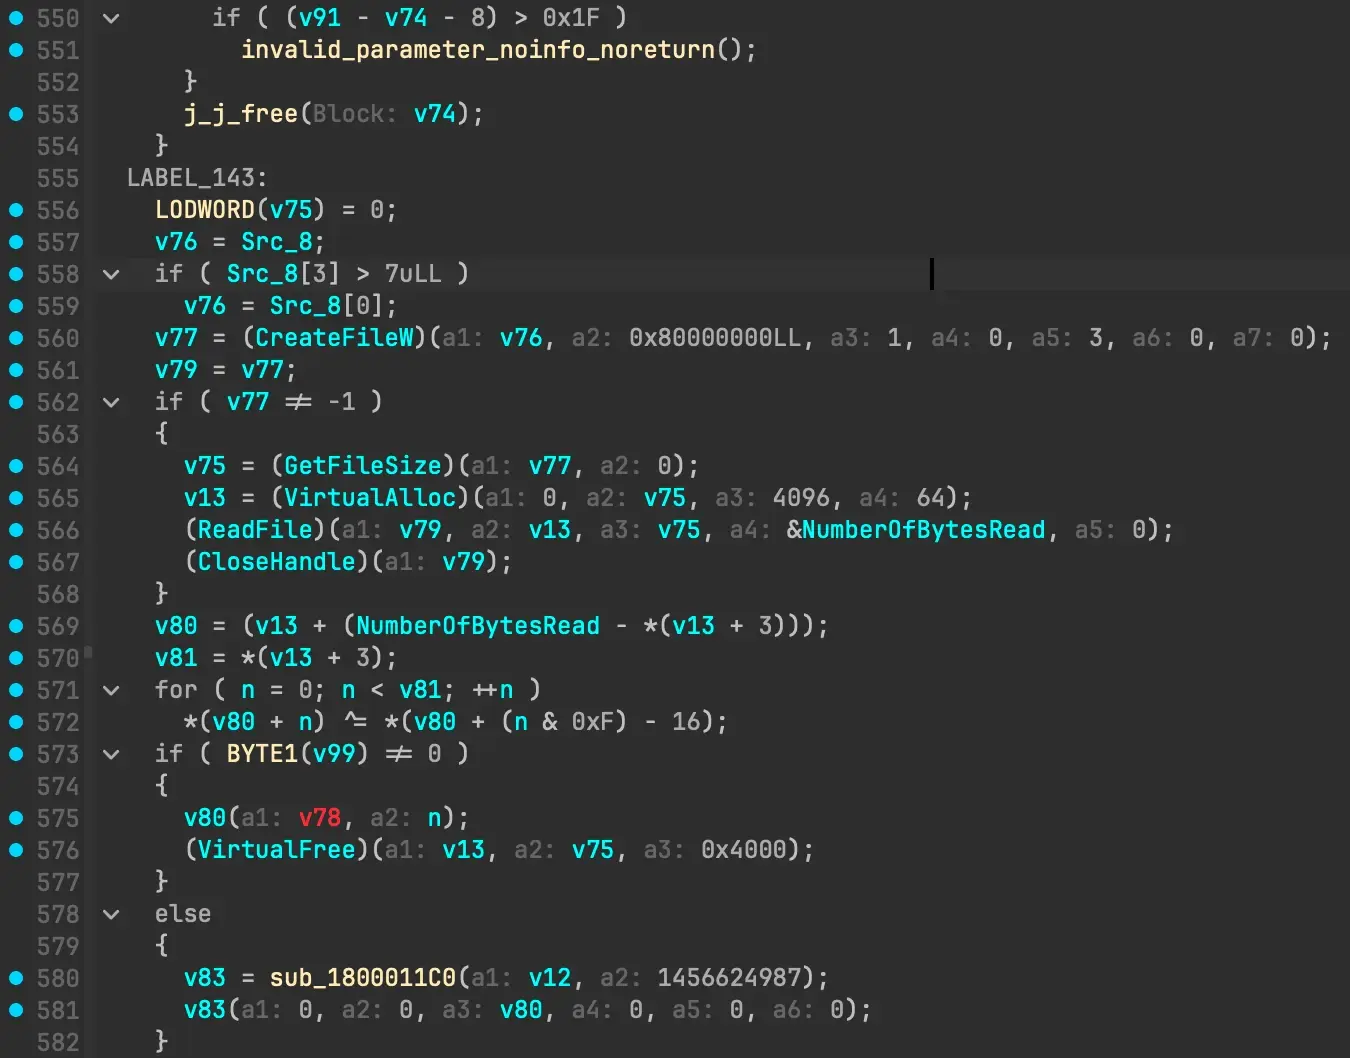 |
Reading closely, it's clear that 6.jpg contains encrypted shellcode that gets decoded and executed via a chain of calls: CreateFileW -> GetFileSize -> VirtualAlloc(RWX) -> ReadFile -> CloseHandle. In the sandbox trace, the subsequent events no longer translate to the IDB, because their code doesn’t come from the mapped image. With the Malware Analysis Add-on, we can import the shellcode directly in the IDB and continue analysis. Double click on a row at an unmapped address and you’ll see the dialog:
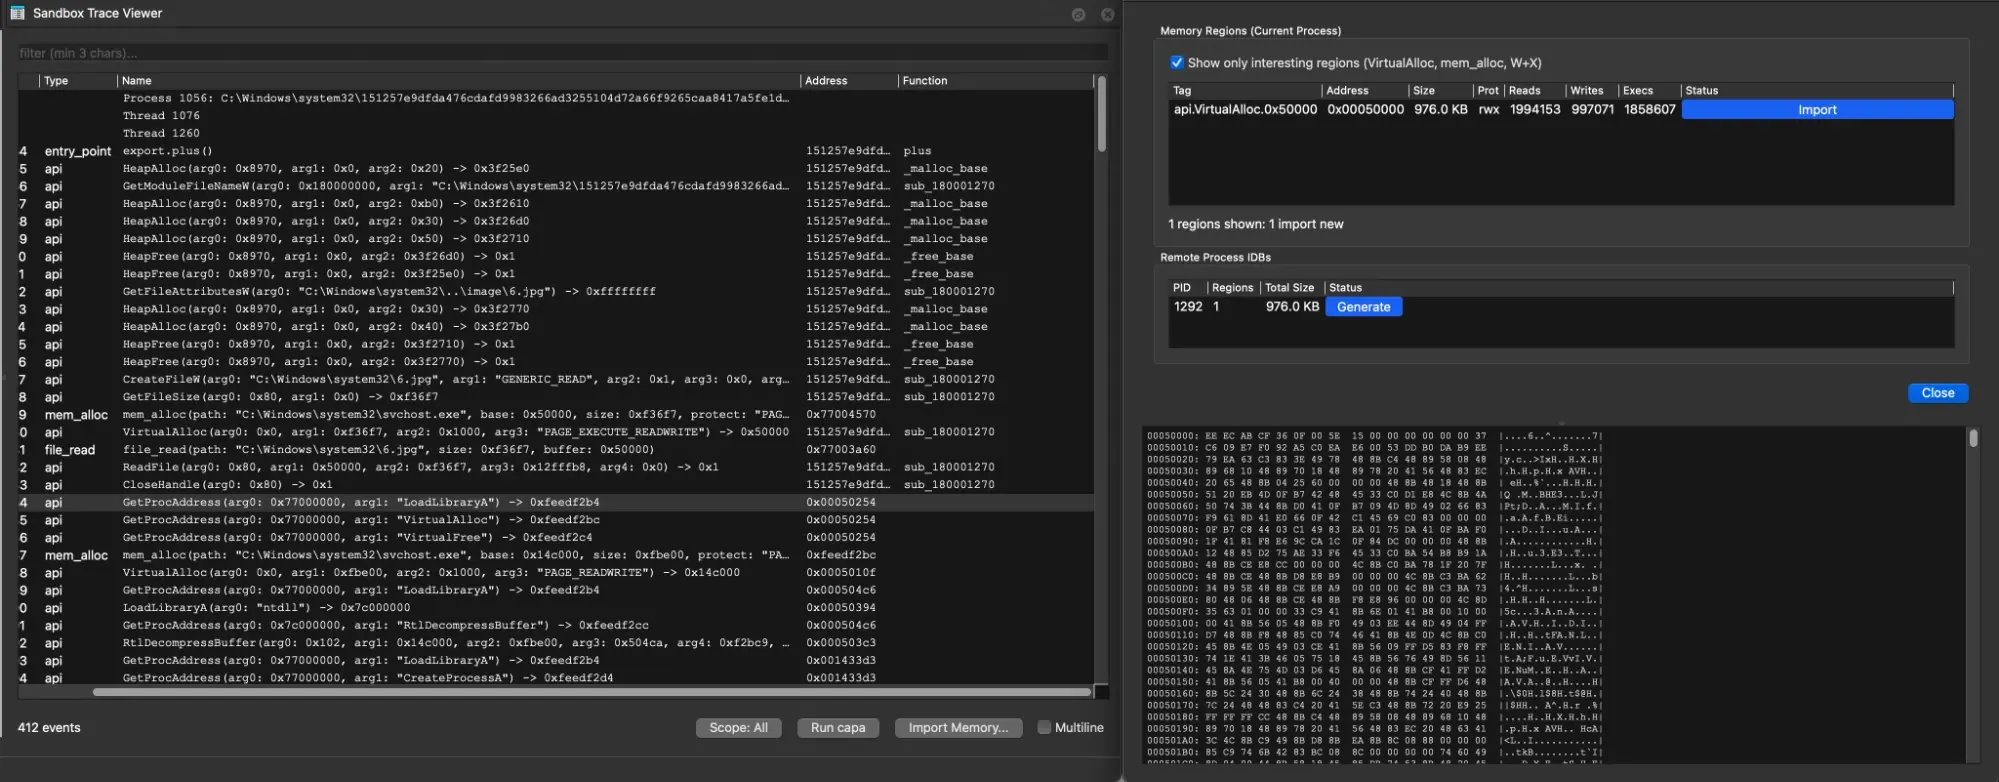
We can import this RWX region, and continue to use the sandbox and disassembly views to find relevant code. Ultimately, it's quick to resolve additional layers of loaders, including LZNT1 decompression and process replacement, to recover the inner payload.
For more examples using the Malware Analysis Add-on, review our How-To guides:
- How to Unpack a Malware Sample
- How to Manually Unpack UPX
- How to Recover a Stack String
- How to Emulate Code from an idalib Script
Enabling AI Agents to Do the Same
As we’ve added techniques to the Add-on, we’ve constantly considered how a headless operator of IDA, such as an idalib script or an AI agent, would use the same feature. We envision a world where the IDA GUI is optional, while custom interfaces and tooling are the norm. For example, under idalib, the Add-on transparently unpacks the sample using its best heuristic, automatically accepting the appropriate dialog options to uncover the inner payload. This way a script, such as a code indexer or string extractor, can work with the inner payload rather than the protector stub. Likewise, the full system emulator can be invoked with a single action (IDC: start_emulator_with_backend("speakeasy")) and then controlled with the existing IDA SDK debugging APIs (ida_dbg). Please let us know what features your agents like best!
Getting Started
There’s a lot more we didn’t get to cover in this post, so we’d strongly recommend digging into the documentation on our website: https://docs.hex-rays.com/add-ons/malware. There you can learn about CyberChef, the Multi-Service Checker, our upcoming deobfuscator, and the details of our VMRay integrations.
| LAUNCH OFFER | -50% |
50% off the Malware Analysis Add-on
Spend less time unpacking and more time on the code that matters. Until December 31, 2026, get the Malware Analysis Add-on at half price with the promo code MALADD50.
Buy now in the webshop or contact sales@hex-rays.com
To get started, first purchase the Add-on using the launch offer above. Already own IDA? To attach the Add-on to your existing license, select that license from your license list before completing your purchase. Then, install it with HCLI:
hcli login
hcli extension install hexrays/malware-analysis
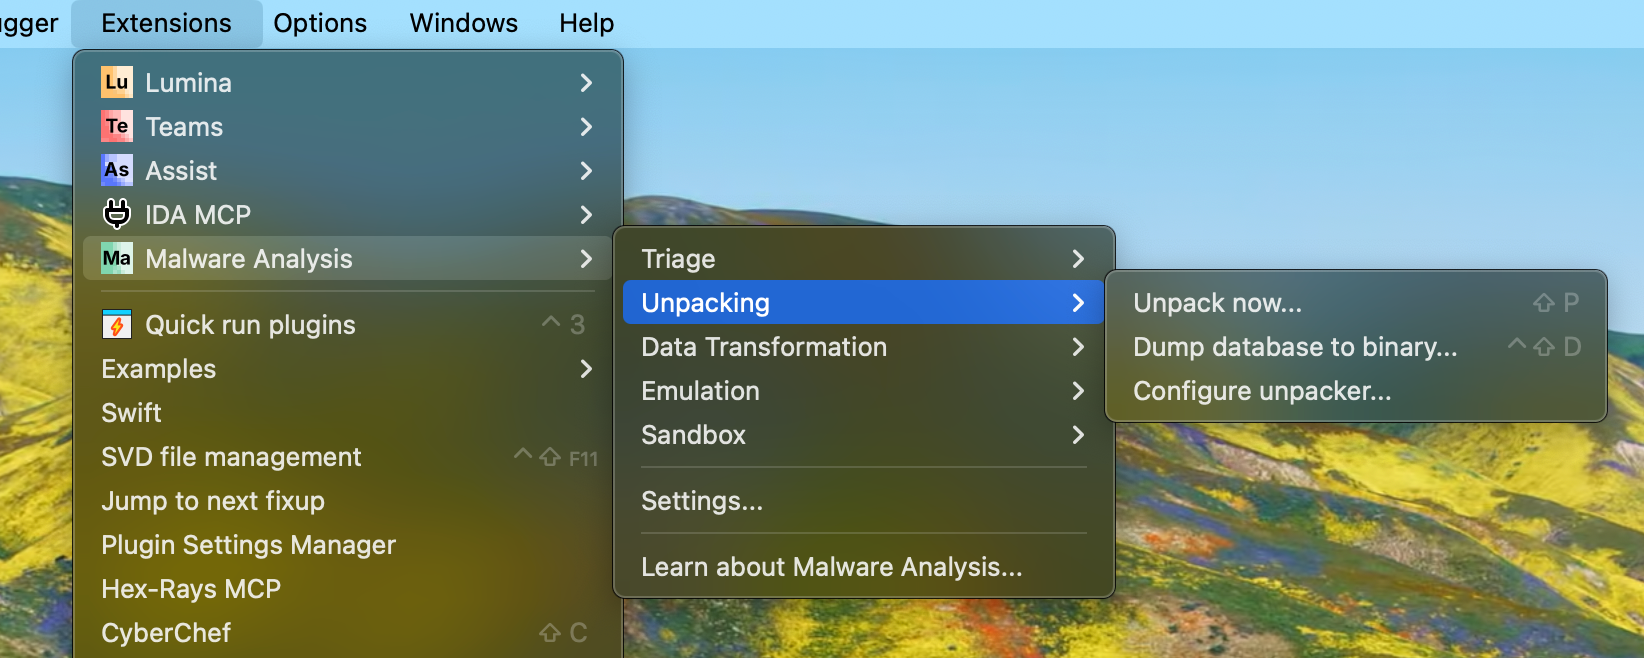
You’ll find your new superpowers under the Extension > Malware Analysis menu: