This is a guest entry written by Chris Eagle. His views and opinions are his own and not those of Hex-Rays. Any technical or maintenance issues regarding the code herein should be directed to the author.
The SK3wldbg Plugin
When I first started analyzing obfuscated code, I quite often wished that I could simply de-obfuscate the code within IDA without the need to run the code under debugger control, capture modified memory regions, and finally copy the modified blocks back into IDA in order to disassemble and analyze the, now de-obfuscated, code.
In 2002, IDA did not yet have a built-in debugger, and IDAPython was still a few years away. Many of my initial efforts to perform deobfuscation involved writing IDC scripts to mimic the behavior of the de-obfuscation routines while writing changes back into the IDA database. When the scripts were finished, I could simply disassemble the modified bytes that were present in IDA. I still have an IDC script that will unpack UPX in place.
I quickly realized that if I’d had an x86 emulator that used IDA as its memory store, I could stop writing new scripts and just run the emulator whenever I encountered obfuscated code. Thus was born the x86emu plugin.

At the time, I didn’t really want to write an x86 emulator from scratch, and I searched for existing emulators that I could modify to suit my purposes. QEMU was the most likely candidate at the time but was almost too fully featured as I had no interest in anything other than the instruction set emulator, and I did not want to invest the time to remove all of the hardware support that QEMU provided.
Fast forward to 2015 and the release of the Unicorn Engine. The developers of Unicorn did exactly what I had elected not to do 12 years earlier, they ripped the hardware support out of QEMU and were able to release a tool that allowed for the easy creation of emulators for most architectures supported by QEMU. In the meantime, Hex-Rays had begun shipping GUI versions of IDA for Linux and OS X in addition to Windows, as well as local and remote debuggers for each of those platforms, including a Bochs-based emulation plugin that provided a native IDA debugging interface to a Bochs emulation of code loaded in IDA.
I decided that the time had come to revisit my effort to bake an emulator into IDA and Unicorn would serve as the core of a new debugger plugin – skw3ldbg.
Debugger Plugins
Most people are familiar on some level with IDA plugins. What people may not be as familiar with is the fact that there are roughly four broad categories of plugin types (FIX, PROC, DBG, and “normal”). Those interested in the finer points should refer to loader.hpp from the IDA SDK for more information about the distinction between each type. Across the IDA plugin ecosystem, “normal” plugins are by far the most common among those that are publicly available.
A debugger (DBG) plugin is specifically designed to facilitate communications between IDA and a debugger being used to run the code you have loaded in IDA. Each of the debuggers that ships with IDA is implemented as debugger plugins and includes local native debuggers for Windows, Linux, and OS X as well as shims that allow IDA to communicate with existing debuggers (WinDbg and gdbserver) or one of Hex-Rays remote debugging servers available for several platforms.
All standard debugging features are available when using these plugins, such as launching new processes, attaching to existing processes, breakpoint manipulating, including hardware and software breakpoint handling as well as arbitrarily complex conditional breakpoints. Debugger plugins need not concern themselves with how information is presented to the user, Hex-Rays has already created a standard set of displays used across all debugger plugins. Instead, each debugger plugin is responsible for furnishing IDA with the information necessary to populate the displays of interest to the IDA user, such as register and memory contents and thread and module-related data. As a result, using any debugger plugin provides a uniform debugging experience regardless of the debugging back end you happen to be communicating with.
Debugging with Bochs as a model emulation
Unique among the Hex-Rays provided debugger plugins is one that allows x86 code to be loaded into a Bochs emulation which is then controlled by the provided IDA debugging interface. No attempt is made to provide a full execution environment for the code that you wish to emulate. In the simplest case, the IDA’s Bochs debugger plugin simply maps the content of your IDA database into Bochs’ memory regions, allocates stack regions in Bochs, initializes registers with some sane defaults, then allows Bochs to begin the emulation. There are some significant limitations to the fidelity of the emulation, however as no additional binaries required by the process, such as libc.so or kernel32.dll are loaded into Bochs, nor does Bochs have access to a kernel that might be capable of handling system calls made by the process under emulation.
Please refer to Debugging with Bochs and Boch’s Help for more information on debugging with IDA and Bochs.
Sk3wldbg
With the Hex-Rays Bochs debugger as a model for emulation-based debugging in IDA, all I needed was the ability to emulate many instruction sets, which became a reality with the release of the Unicorn Engine.

Debugger plugins must instantiate a debugger_t object and then set the global dbg pointer in IDA to point to the debugger_t instance. The majority of the implementation of a debugger is implemented in a mandatory callback function that processes more than 40 debugger-related notification messages. Fortunately, Hex-Rays provides a large amount of debugger-related example code as part of the IDA SDK to assist in understanding the required behaviors.
In the sk3wldbg implementation, debugger_t is subclassed for Unicorn-specific behaviors, then subclassed again for each architecture supported by Unicorn. When IDA is operating on a binary whose processor is supported by Unicorn, an appropriate debugger instance is constructed based on the current processor module, and Sk3wldbg will be listed as an available debugger option. When execution begins, sk3wldbg attempts to map and load the original disk file into Unicorn memory space using crude PE or ELF loaders. For other file types, sk3wldbg maps and loads the Unicorn memory space using segment information and content from IDA. In both cases, a stack region is mapped into Unicorn, and initial register values are assigned. Emulation occurs in a separate IDA qthread and synchronization is performed using a shared event queue and IDA qsemaphore objects.
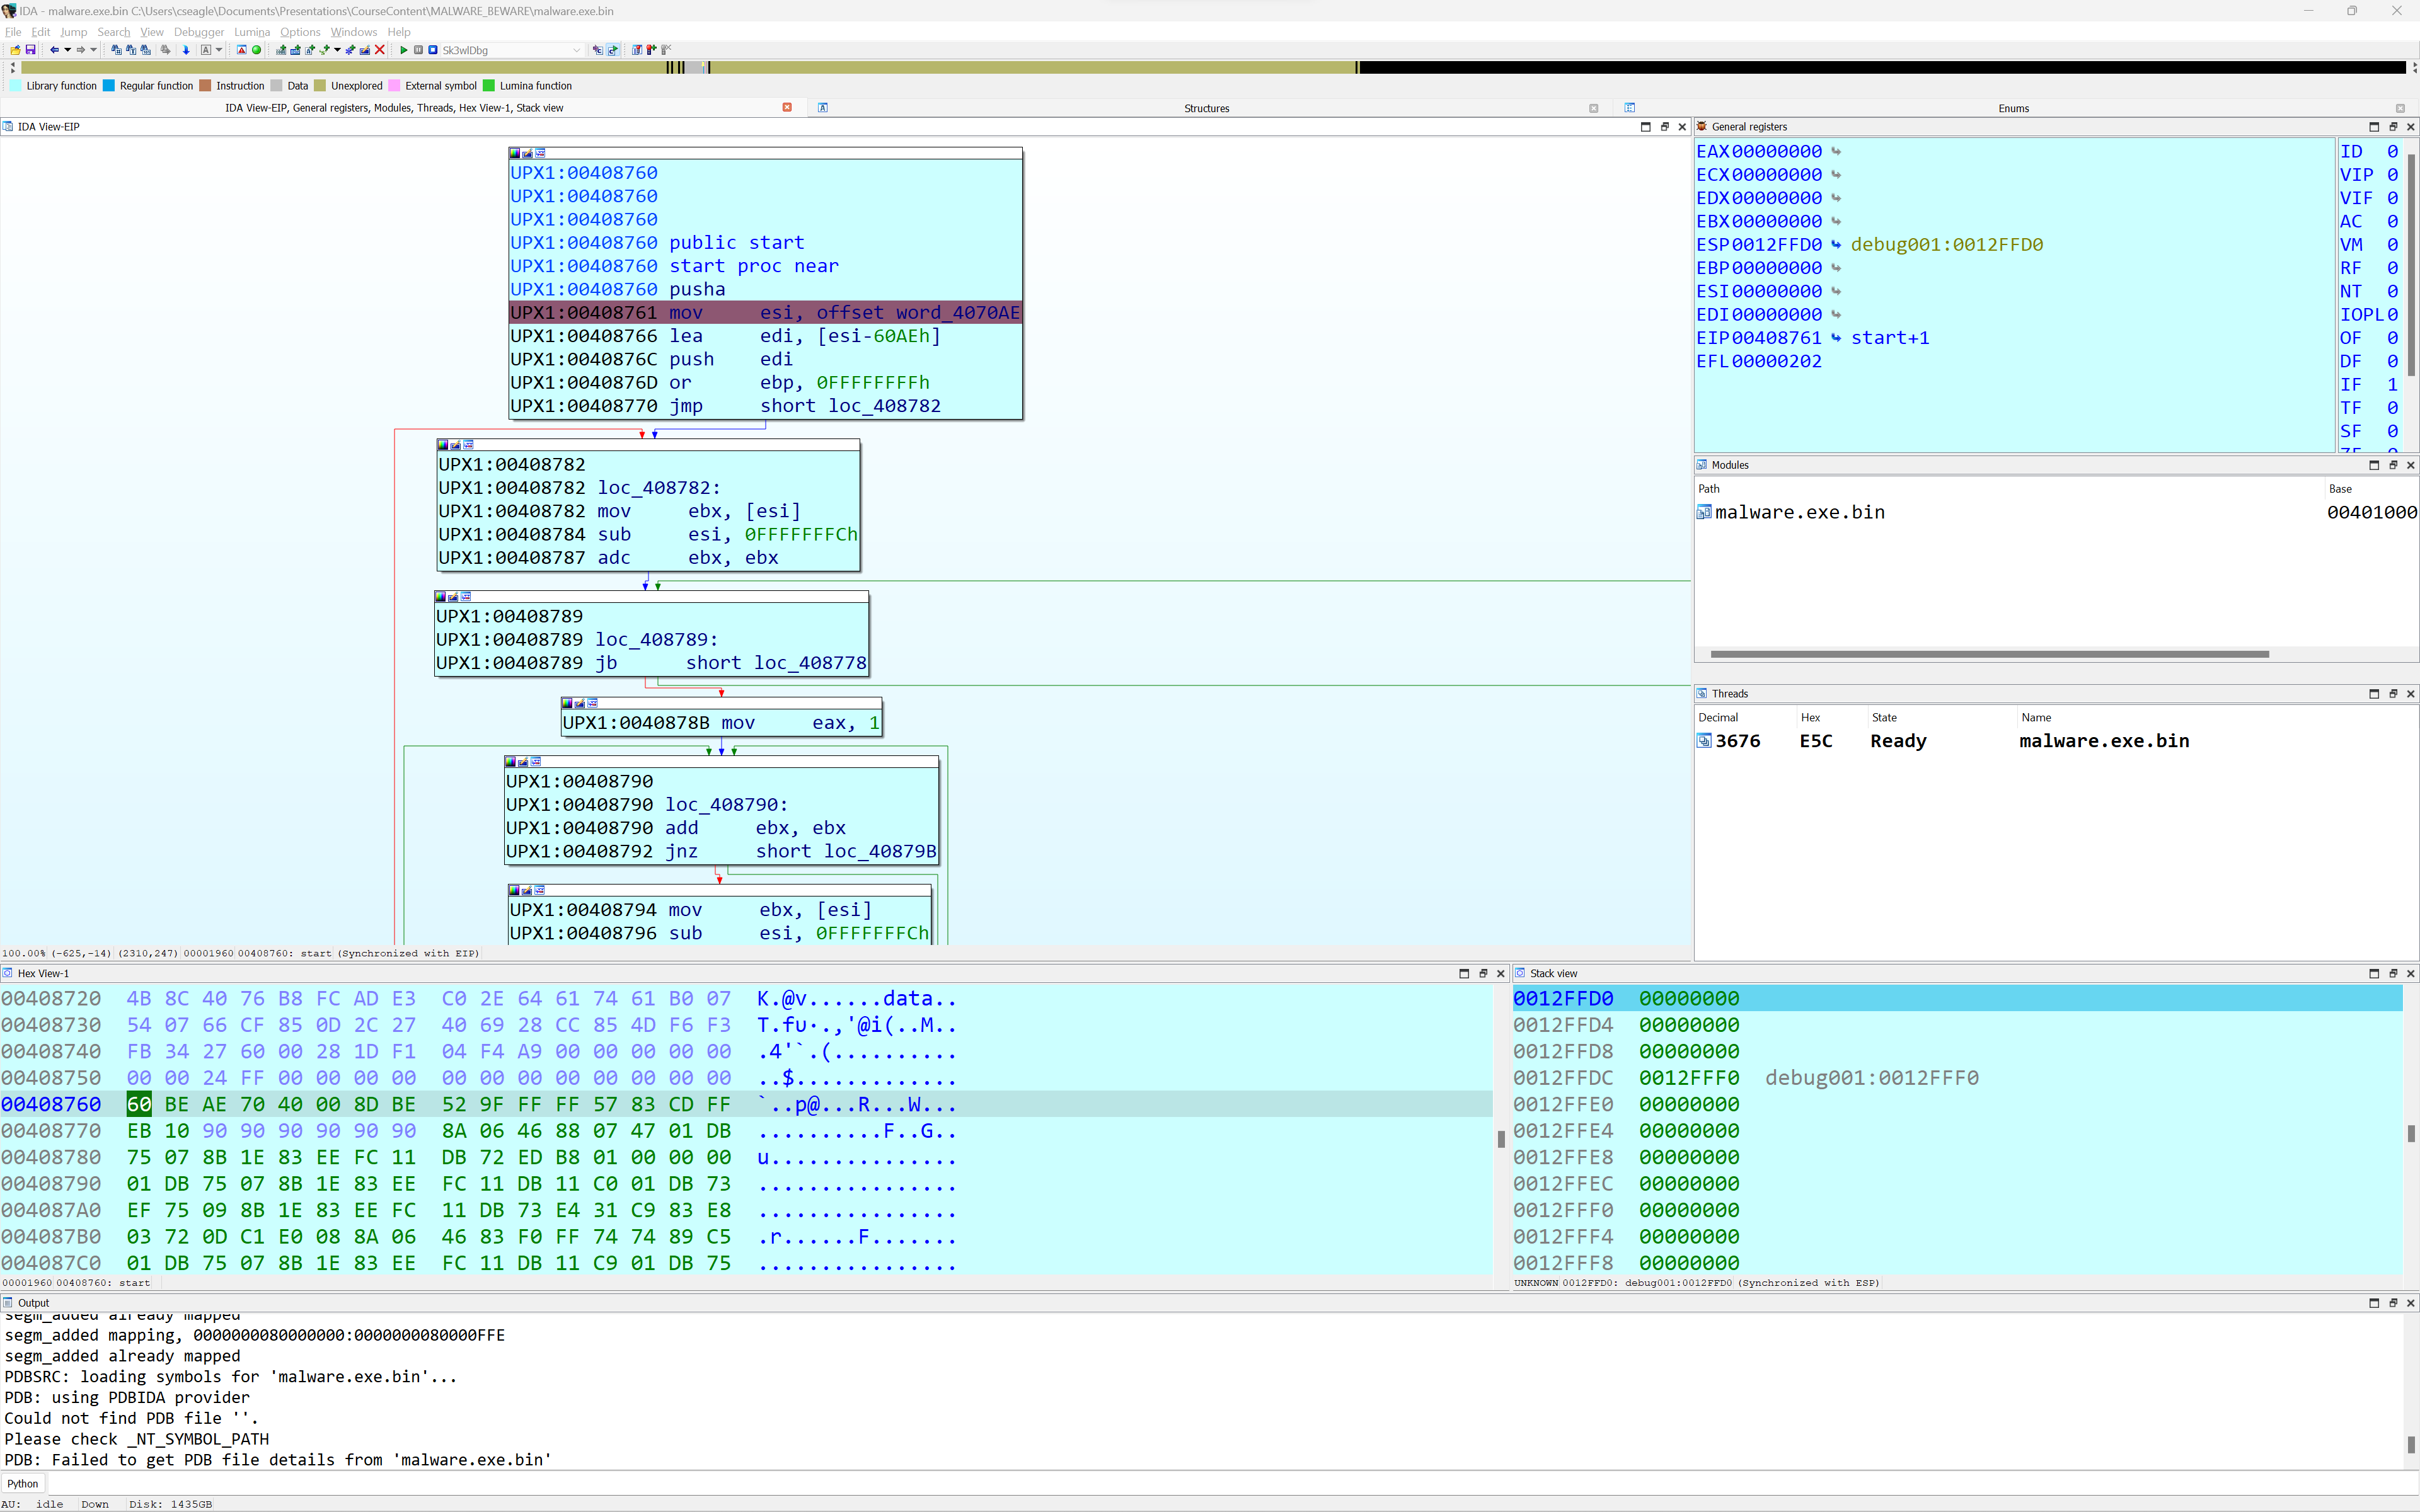
Once execution begins, the user experience is similar to that of using any of IDA’s other debuggers, including the use of breakpoints, execution controls, and the ability to take memory snapshots. Breakpoints more closely resemble hardware breakpoints (software breakpoints are not inserted in the Unicorn memory space), and they are monitored by hooking the execution of each instruction in the execution thread.
Installation
Sk3wldbg is available on GitHub using the supplied Makefile or Visual Studio solution file. Copy the resulting plugin (sk3wldbg_user) into IDA’s plugins directory and make sure that you have Unicorn installed on your system and if all goes well, sk3wldbg will show up and be available in IDA as a debugger option.

Usage
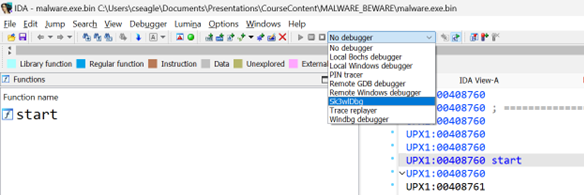
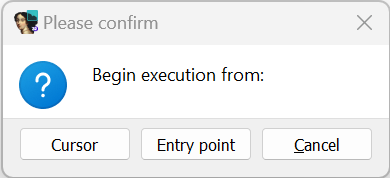
After choosing Sk3wldbg as your debugger and setting some breakpoints, launch a debugging session using Debugger/Start process or the Start process toolbar button. Sk3wldbg asks where execution should begin.

Select either the cursor location or the program entry point as your initial program counter value and control execution as you would any other process that you are debugging. NOTE: It is a good idea to set a breakpoint near the execution start point in order to make sure that you gain control over the emulation.
Limitations
- Sk3wldbg can only execute code that is present in your IDA database. It cannot currently follow execution into shared libraries or handle system calls.
- None of the notifications required to support the Appcall interface are currently implemented.