
The last time
I showed you a simple trick with conditional breakpoints.
Today I will present you a plugin which automates these breakpoints – to the extent
that a protected malware like the Zotob worm can be unpacked.
Since it is dangerous to experiment with a live malware we will
use a sample program in our demonstration. Zotob is packed with a variant of the
Yoda’s Protector (beware of popup windows if
you click on the link!). We will take this
sample program.
and protect it with the protector. Then we will try to unpack it.
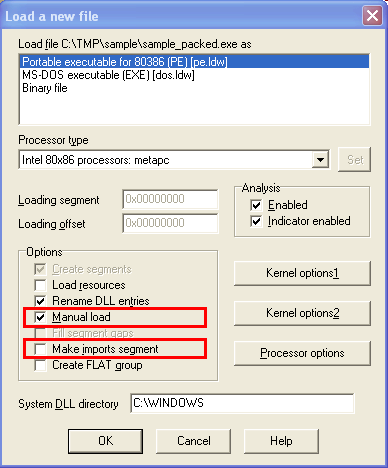
IDA complains a lot about the packed executable but manages to load it.
It finds the entry point for this packer but in general when you handle
malware, turning on the manual load option and turning off the
make imports section option is a good
idea. The manual load will give you a chance to load all section of the input file
to the database (malware may hide its code anywhere in the file). Not creating the
imports section will display the import directory contents fully in the original form
– again, who said that malware can not hide itself in the import directory?
The first thing we encounter trying to follow the unpacker in the debugger is
that there are too many exceptions. You have to be very careful with fake calls and
exceptions. Un faux pas and we find ourselves in the middle of nowhere,
the program running wild, crash or even closing the debugger. It is a deliberate thing – packer
authors love to complicate things and render the analysis almost impossible. The key word
is almost. If a program has to run without
requiring special keys or additional data then it can be made run under a virtual
environment and dissected fully. Today we will not virtualize the
whole environment but only a very small part of it – we will render some Windows
API calls useless to the unpacker.
Ok, back to the program. The unpacker uses the SEH (structured exception handling)
in the unpacking process and IDA keeps reporting about each exception. There might be
hundreds or even thousands of them. By default IDA comes configured as most of other
debuggers: it suspends the program as soon as there is an exception. This behaviour
is good for ‘normal’ debugging but does not help when tracing a malware.
Let’s change the exception handling so that IDA does not stop at each exception.
You can do it from the user interface (Debugger, Debugger options, Edit exceptions)
or by editing the cfg/exceptions.cfg file. The second method is better because
the settings will be used for all future databases while the first method will
change the settings only for the current database. We will tell IDA that all
exceptions must be handled by the application.
Here is a line from the new configuration file:
0xC0000005 nostop app EXCEPTION_ACCESS_VIOLATION The instruction at 0x%a referenced memory at 0x%a. The memory could not be %s
This line means that the execution will not stop (nostop) and the application will handle it (app).
If you have some experience with IDA, you might have noticed that sometimes IDA still stops
at an exception despite of such a setting. IDA will stop at an exception if this is
a ‘second chance’ exception: a non handled exception of second chance will terminate the application
and IDA gives you a chance to do something about it.
If you replace your configuration file with this
file
then you will be able to load in into the database using the Load button in the
Debugger, Debugger options dialog box.
With the new configuration file it is much easier to single step the program. You
can even set a breakpoint at 4766A4 to see the next trick – self modifying code at
4766A8 (just several instructions below). When you once execute ‘stosb’ at
4766A5, you can press F8 at 4766A6 and the code will appear on the screen.
I will not describe in detail every and each trick in the unpacker, there are other sites
doing the job very well. Instead, let’s put a hardware breakpoint at 476854 and
rerun the program. You will see that the unpacker merrily and diligently does it job and can not
detect the debugger using SEH tricks.
Why did we use a hardware breakpoint and not a software one? The reason is because the
application can detect a software breakpoint easily. For example,
at 4775CE there is a checksum calculating function and it uses the opcode bytes to calculate it.
If you use software breakpoints, the checksum will be incorrect and the packer will crash
somewhere later. In general it is a good idea to use hardware breakpoints but unfortunately
IDA does not have the option to use them automatically. I personally use hardware breakpoints
to rerun the malware from the start to a certain address. Mistakes are inevitable but
hardware breakpoints let me to repeat the whole debugging session up to the last known address.
The good side is that I can continue the debugging session even several days later, reboot
my computer, etc.
If you have put a hardware breakpoint at 476854 you will see the followng code:
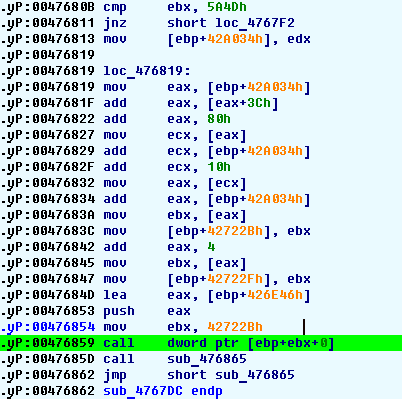
We are to perform an indirect call. Since we are in the debugger we can easily find
out the function to be called but the listing looks ugly. Let’s fix it using an IDA Pro command.
The unpacker uses many references based on the EBP register. Apparently
the EBP register does not change. We will select the whole screen and
use the ‘user-defined offset’ command:
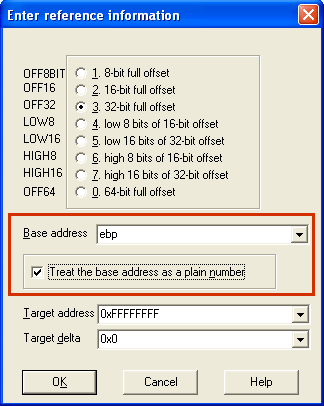
The offset base is EBP and it is a plain number (it does not hold an address).
Since we have selected a region, there is one more additional dialog box:
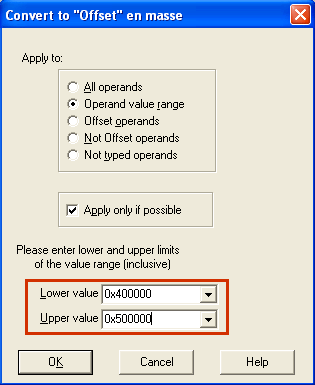
We ask to convert everying in the 400000..500000 range to offsets.
The result is much better than the original:
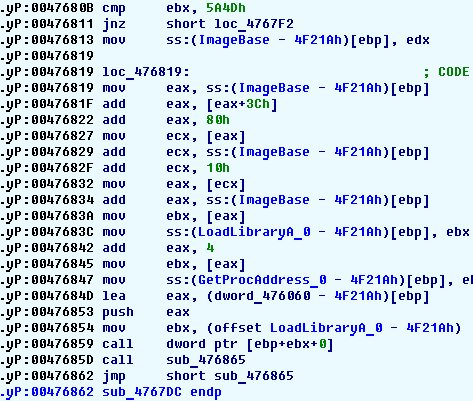
We see that the unpacker uses the LoadLibrary function to access Windows API
functions. It will retrieve the addresses of many functions and create its
import table. If you let the program run up to 476E77 (you may use a hardware breakpoint
for that), you will see the import table at 476451:
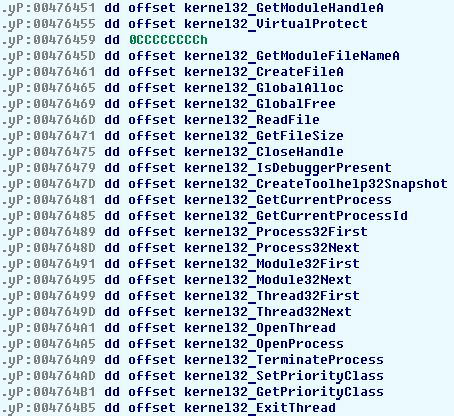
(by default the table is not visible; you’ll need to position the cursor at
its beginning, create a dword and then array of dwords). The table is not good enough because it contains
references to names but its entries are not named. Entries in the import table will be used
one by one and without names the listing will not be readable.
The following short script, entered in the script dialog box (F2 is the hotkey)
corrects the table:
auto ea, name;
for ( ea=here; ea < 0x476545; ea=ea+4 )
{
  name = Name(Dword(ea));
  name = substr(name, strstr(name, "_")+1, -1);
  MakeName(ea, name);
}
Here is the result:
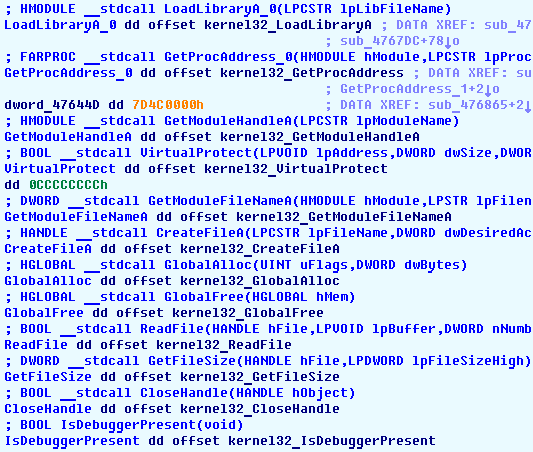
Looking at the table we can see many nasty functions. The famous IsDebuggerPresent is there, and
also functions like SuspendThread, TerminateProcess,
BlockInput do not look innocent.
Here is the idea: we will create conditional breakpoints at all these dangerous functions
with the following condition:
(EIP=address_of_ret_instruction) && (EAX=return_value)
For example, in the BlockInput function
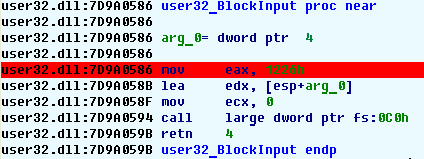
The breakpoint condition will be
(EIP=0x7D9A059B) && (EAX=0x1)
This breakpoint will skip the function execution and provide the predefined answer.
It will not suspend the execution.
The unpacker will have
no chance of blocking the user input, detecting the debugger and terminating it.
Even it tries, it will fail.
Since it is tedious to manually set these breakpoints each time you run an application, I
made a
plugin.
It is quite simple and comes with the source code.
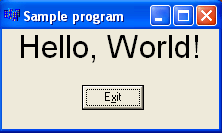
With this plugin, running the application without being detected is simple: activate the plugin
and run the debugger. The application will unpack itself and run without doubting anything:
I anticipate the next question: "how to detect the moment when the unpacker finishes its work and
switches to the original application code". Unfortunately there is no simple answer to this question (even if there
were one, the next packer author would make it obsolete at once).
It is a nice question with many possible answers. Maybe we will consider it in the future.
Files:
Sample 'hello world' program with the source code
Plugin source code, binary code for IDA 4.9 and new exceptions.cfg