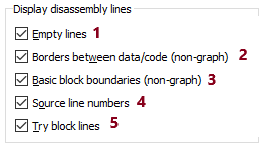
Continuing from last week, let’s discuss other disassembly options you may want to change. Here’s the options page again:

Disassembly line parts

This group is for options which control the content of the main line itself. Here is an example of a line with all options enabled:

The marked up parts are:
- The line prefix (address of the line).
- The stack pointer value or delta (relative to the value at the entry point). Enabling this can be useful when debugging problems like “sp-analysis failed”, “positive sp value has been detected”, or “call analysis failed”.
- Opcode bytes. The number entered in the “Number of opcode bytes” specifies the number displayed on a single line at most. If the instruction is longer, the rest is printed on the second line. If you prefer to truncate the extra bytes, enter a negative number (e.g. -4 will display 4 bytes at most, the rest will be truncated).
- Comments for instructions with a short description of what the instruction is doing (may not be available for all processors or all instructions).
Display disassembly lines

This group of options control display of lines other than the actual line of the disassembly for a given address (main line).

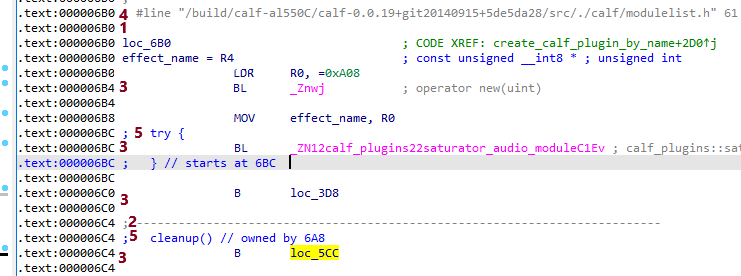
- Empty lines: this prints additional empty lines to make disassembly more readable, especially in text mode (e.g. between functions or before labels). Turn it off to fit more code on screen.
- Borders between data/code: displays the border line (
;------------) whenever there is a stop in the execution flow (e.g. after an unconditional jump or a call to a non-returning function).
- Basic block boundaries: adds one more empty line at the end of each basic block (i.e. after a call or a branch).
- Source line numbers: displays source file name and line number if this information is available in the database (e.g. imported from the DWARF debug information).
- Try block lines: enables or disables display of information about exception handling recovered by parsing the exception handling metadata in the binary.


