Although IDA has been created first and foremost to analyze binaries in “black box” mode, i.e. without any symbols or debug information, it does have the ability to consume such information when available.
The debugger functionality was also initially optimized to debug binaries on the assembly level, but nowadays can work with source code too.
Source-level debugging
Source-level debugging is enabled by default but can be turned off or on manually via Debugger > Use source-level debugging menu item, or the button on the Debug toolbar.

If the input file has debugging info in the format supported by IDA (e.g. PDB or DWARF), it will be automatically used when the debugging starts and the code being executed is covered by the debug info.

Source code files
If source files are present in the original locations, IDA will open them in separate source view windows and highlight the currently executing line. The assembly instructions are still shown in the IDA View, and you can continue to use it for analysis independently of source code view. Note that IDA may automatically switch to disassembly when stepping through instructions which do not have a correspondence in the source code (for example, compiler helper functions, or auxiliary code such as prolog or epilog instructions).

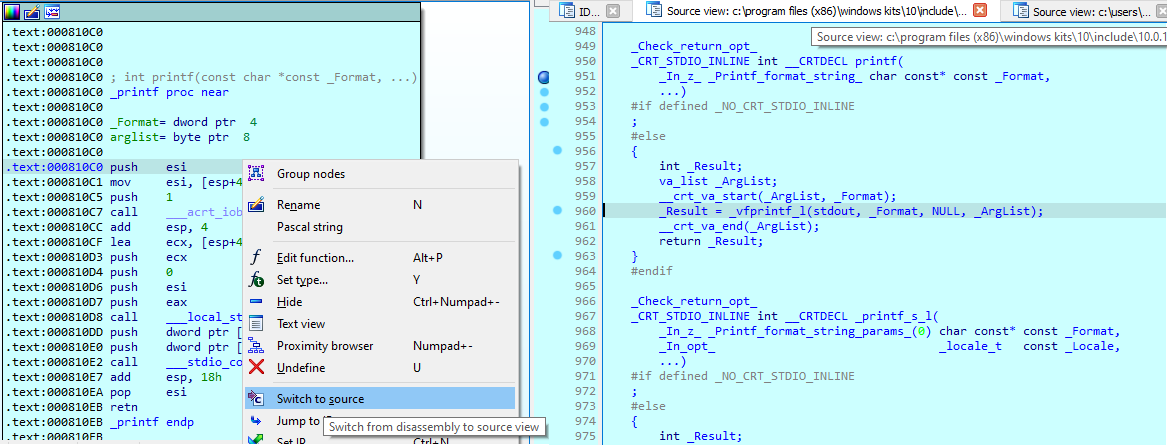
When, after stepping through disassembly, the execution returns to the area covered by the source code, you can ask IDA to show the corresponding source code again via the action Debugger > Switch to source (also available in context menu and toolbar). This action can be used even for code away from the current execution point.
Source path mappings
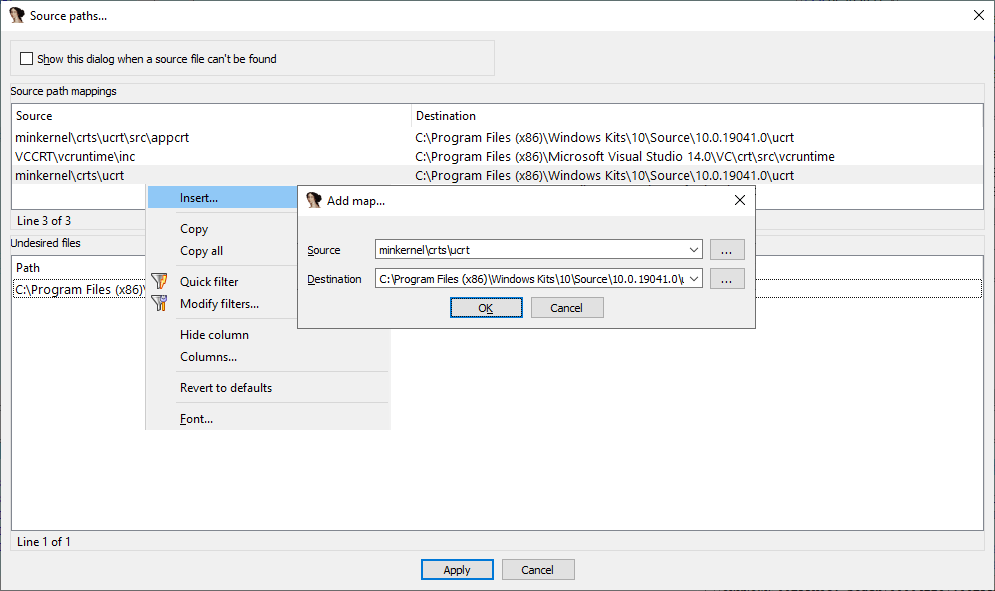
Sometimes the source code corresponding to the binary may be available but in a different location from what is recorded in the debug info (e.g. you may be debugging the binary on a different machine or even remotely from a different OS). The files which were not found in expected location are printed in Output window:

Using Options > Source paths…, you can set up mappings for IDA to find the source files in new locations.
Locals
When the debug info includes information about local variables, IDA can use it to show their values. A short, one-line version is shown when you hover mouse over the variables in source code view.

For more complex objects it may be more convenient to open the dedicated view where you can expand and inspect fields and sub-objects. This view is available via the menu Debugger > Debugger windows > Locals.

Watches
In addition to locals, you can also watch only specific variables you need instead of all locals, or values of global variables. This view can be opened via Debugger > Debugger windows > Watch view. Variables can be added using Ins or context menu.

Debugging pseudocode
Even if you don’t have debug info for the code you’re debugging but do have a decompiler, it is possible to debug pseudocode as if it were a source file. IDA will automatically use pseudocode if source-level debugging is enabled but there is no debug info for the specific code fragment you’re stepping through. You can also always switch to pseudocode during debugging using the usual Tab hotkey. Locals, Watches, and source-level breakpoints are available when debugging pseudocode in the same way as with “real” source code.

P.S. attentive reader may discover an additional surprise in this post. Happy Easter! 😉