Audience
IDA 7.2 was an exciting release for Mac users. With the advent of
ARMv8.3-A extensions, new
kernelcache and
dyldcache formats, and the
ARM64e
architecture for iOS, there's never been more demand for a reversing tool that can clear all of Apple's various hurdles.
This writeup is geared towards the Mac power users (or really anyone interested in reversing Apple binaries) who want to get the most out of IDA's more "Darwinesque" features. Here we will push these capabilities to their limit - to
get a snapshot of the current state of things, address some immediate issues, and get a sense of IDA's trajectory for the future.
Overview
ARM64e/ARM64_32
iOS 12 introduced the
ARM64e Mach-O file format for binaries that utilise ARMv8.3 PAC extensions. IDA 7.2 fully supports ARM64e, and should be able to disassemble/debug/decompile almost any iOS 12 binary found in the
wild. The majority of this post focuses on the various "flavors" of ARM64e binaires, and what can be done to refine their analysis.
Before we get started, let's make a quick note about watchOS.
ARM64_32
The Apple Watch Series 4 introduced a unique processor architecture:
ARM64_32.
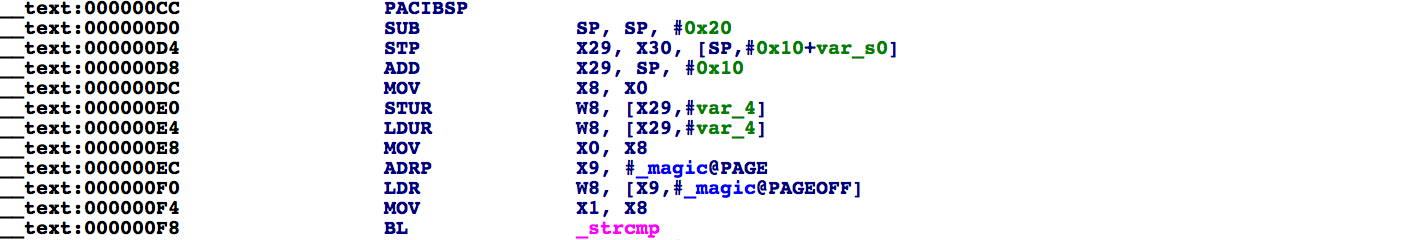
S4 processors have a 64-bit instruction set but use a 32-bit address space in order to save some memory. IDA 7.2 can disassemble S4
binaries but you must use ida64.app, since ida.app cannot properly disassemble 64-bit code. It might feel strange using ida64 to analyze
binaries that are (technically) 32-bit, but in spite of this peculiarity the disassembly is quite clean:
If we explore the segment information in IDA, we get some expected results:
Python>idaapi.cvar.inf.is_64bit()
False
Python>idaapi.getseg(0xCC).use64()
False
Python>idaapi.getseg(0xCC).use32()
True
However, this is not expected:
Python>insn = idaapi.insn_t()
Python>idaapi.decode_insn(insn, 0xCC)
Python>insn.is_64bit()
False
Internally, IDA classifies 64-bit instructions as "appearing in a 64-bit segment", rather than "part of a 64-bit instruction set". Thus, insn_t::is_64bit will return
false for ARM64_32 instructions. This is why there
is currently
no decompiler support for ARM64_32. The decompiler assumes that 64-bit code only appears in 64-bit segments and will refuse to operate on S4 binaries.
We will fix this for IDA 7.3 if the demand is high enough.
Kernelcaches + Lumina
iOS 12 introduced a new kernelcache format. Naturally IDA 7.2 can load these files and identify the KEXTs:
Detected file format: Mach-O file (EXECUTE). ARM64e
Loading prelinked KEXTs
FFFFFFF00813B6F8: loading com.apple.iokit.IOSlowAdaptiveClockingFamily
FFFFFFF00813C9B0: loading com.company.driver.modulename
FFFFFFF00814CFF0: loading com.apple.iokit.IOReporting
FFFFFFF00814EB28: loading com.apple.driver.AppleARMPlatform ...
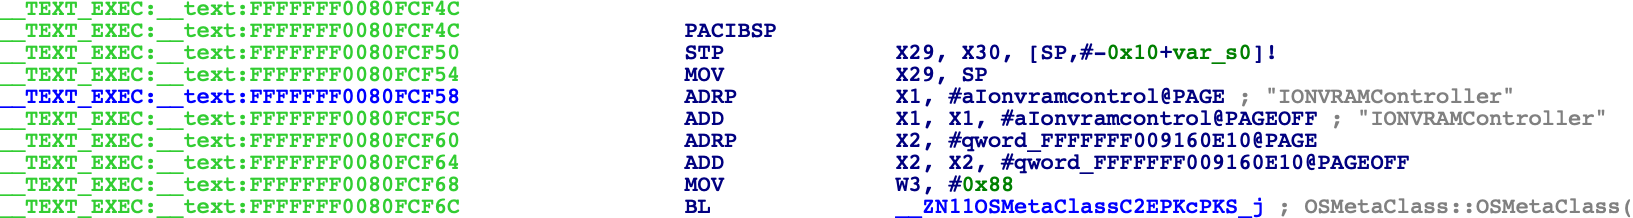
But our satisfaction is short-lived. Immediately we see that the latest kernelcaches are completely stripped of all symbol information, so we're left with ugly auto-generated names like
sub_FFFFFFF00* for all
functions. This is where
Lumina can save the day.
In this example we use an ARM64e kernelcache from an iOS 12.1 OTA for iPhone XS.
Let's load this file and wait for IDA analyze it. Since we're unhappy with the lack of symbol information, we can ask Lumina:
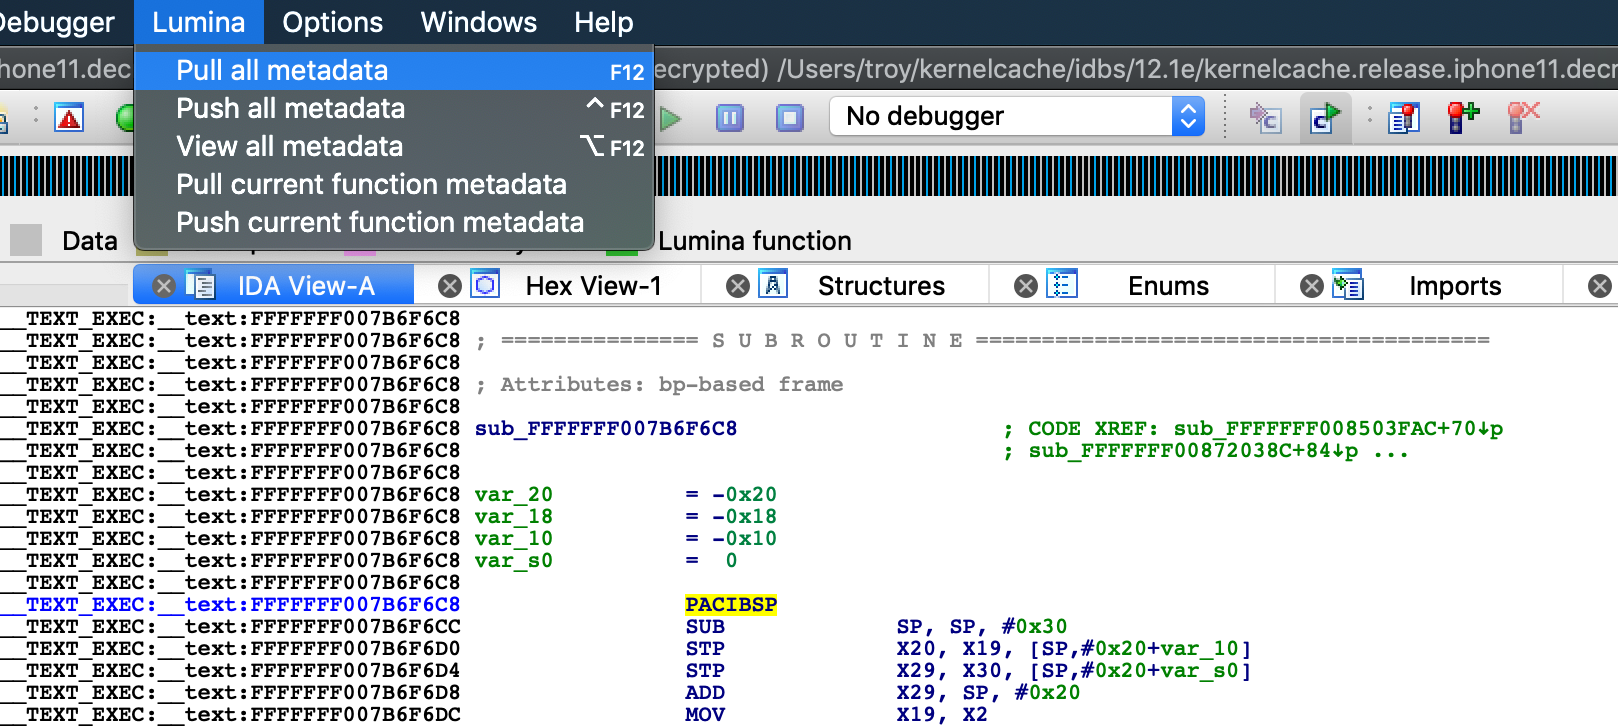
And wait for Lumina to download metadata for any recognized functions:
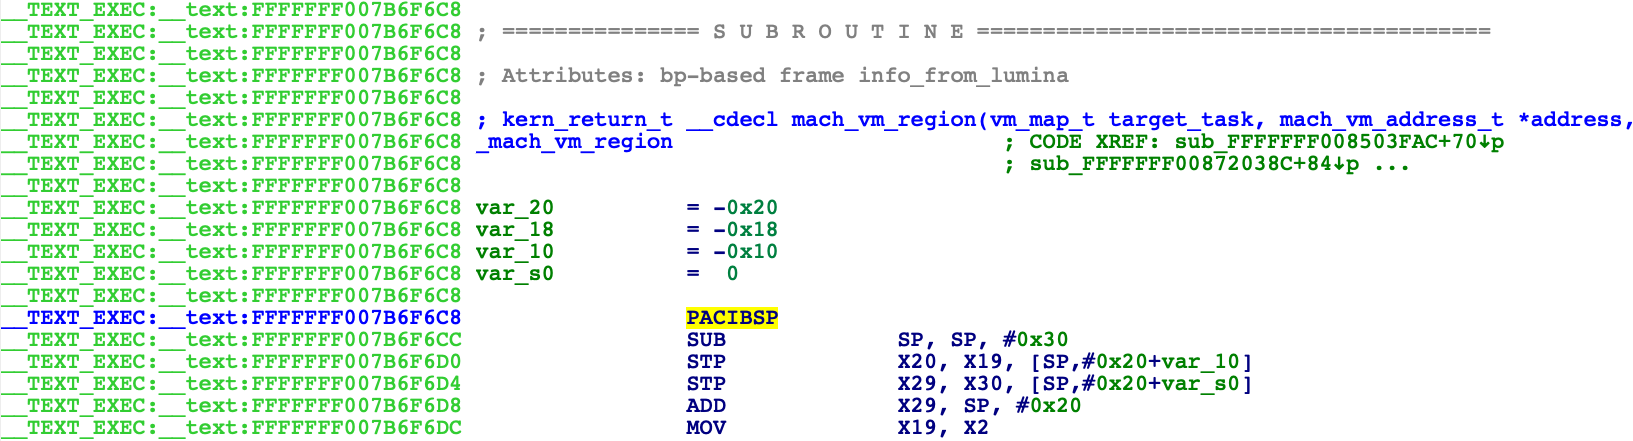
You can see the mystery function
sub_FFFFFFF007B6F6C8 was recognized as
mach_vm_region, and we even have a nice prototype.
Currently Lumina can recognize around 6600 functions from the latest ARM64e kernelcaches. The exact number of identified functions
will vary, but it will likely increase over time as people continue to use Lumina. We expect to see a particularly large bump after the new XNU sources are released.
Fortunately the situation is even better for plain ARM64 (not ARM64e) kernelcaches. An early version of the iOS 12 beta leaked a non-stripped version of the ARM64 kernelcache, which was promptly uploaded to the Lumina server. As a
result, for some stripped ARM64 kernelcaches like the one from
here, Lumina can recognize over
37,000 functions.
It is unlikely we will receive such a gift for ARM64e kernelcaches but in case we do, Lumina can quickly make it available to everyone.
Broken Operands
After pulling Lumina metadata, you may notice that some operands have been colored red:
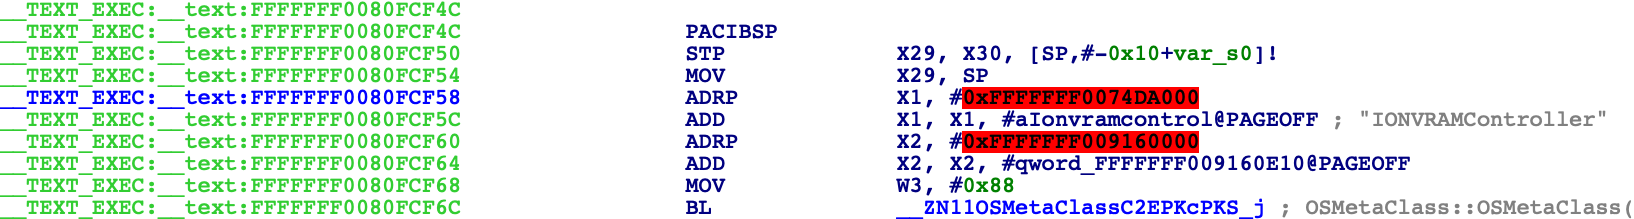
This is due to an issue that we have fixed since the 7.2 release. We are happy to send a hotfix to anyone interested, but in case you have already applied broken metadata to your database and require an immediate workaround, try
copying this Python script to your snippets window (Shift+F2):
# repair custom offsets in the current function
func = idaapi.get_func(here())
if func is not None:
    fii = idaapi.func_item_iterator_t()
    ok = fii.set(func, func.start_ea)
    while ok:
        ea = fii.current()
        for opno in [1, 2]:
            opinfo = idaapi.opinfo_t()
            if idaapi.get_opinfo(opinfo, ea, opno, idaapi.get_flags(ea)) and opinfo.ri.is_custom():
                idaapi.clr_op_type(ea, opno)
        ok = fii.next_head()
Running this script should repair any broken operands in the current function:
We find it simpler to run the script per function as needed, but it can be easily applied to all functions if you prefer to fix everything at once (and you're willing to wait a short while):
# repair custom offsets for all known functions with Lumina metadata
import idautils
for ea in idautils.Functions():
    func = idaapi.get_func(ea)
    if func.flags & idaapi.FUNC_LUMINA != 0:
        print "repairing: %s" % idaapi.get_name(ea)
        fii = idaapi.func_item_iterator_t()
        ok = fii.set(func, func.start_ea)
        while ok:
            ea = fii.current()
            for opno in [1, 2]:
                opinfo = idaapi.opinfo_t()
                if idaapi.get_opinfo(opinfo, ea, opno, idaapi.get_flags(ea)) and opinfo.ri.is_custom():
                    idaapi.clr_op_type(ea, opno)
            ok = fii.next_head()
OpenSSL
Lumina requires OpenSSL version 1.0.1d or later. Until recently OSX has shipped with older versions that Lumina cannot use.
Finally in OSX 10.13 High Sierra, Apple has switched to LibreSSL 2.2.7, which is compatible with Lumina. Thus, Lumina should work out of the box on OSX 10.13 and later. If you are working with an older MacOS version, you must either
update OpenSSL via homebrew or simply update your OSX version to work with Lumina.
DYLD Shared Cache Utils
The
dscu plugin arose from the reality that there were only two viable options when loading a dyldcache in IDA, and neither of them were good enough. You could either choose the
single module option
(which would usually deliver incomplete analysis), or the
single module plus dependencies option (which could load hundreds of modules and generate a massive database).
dscu allows you to load any module you want, on-command, from the UI or from a script. In other words,
you can decide which modules are important. The plugin has become a bit of a game-changer for dyldcache analysis in IDA
(if this is your first experience with dscu, please check out the
Help page and the
whatsnew for a quick intro).
In spite of dscu's helpfulness, there are still some gotchas to watch out for. We will discuss them here.
Broken Tail Calls
In this example we will be analyzing dyld_shared_cache_arm64e extracted from
iPhone11,2_12.0_16A366_Restore.ipsw. Let's open this file in IDA with load option
Apple DYLD cache for arm64e (single module), and choose the module:
/System/Library/Frameworks/ARKit.framework/ARKit
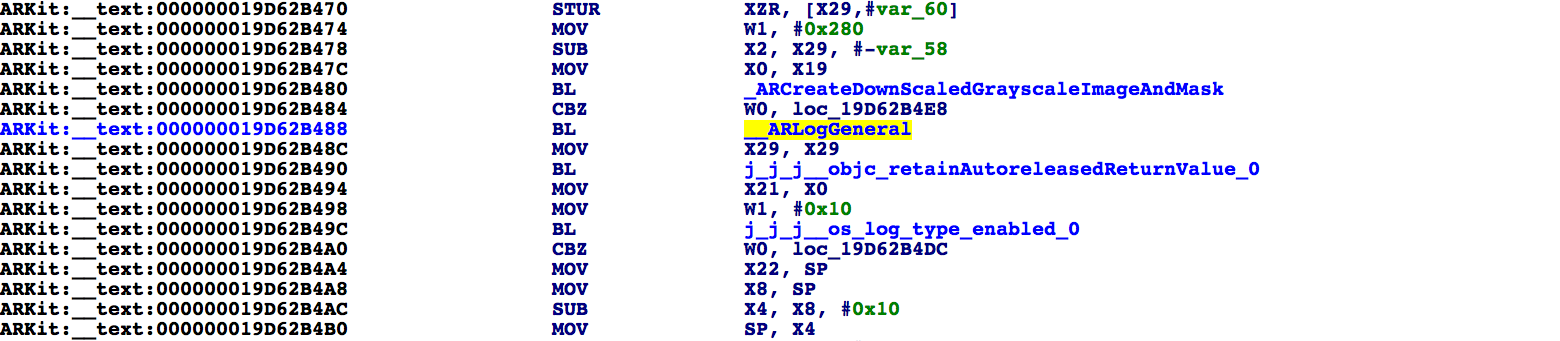
Allow IDA to finish analyzing the file, and navigate to the method:
-[ARReferenceImage initWithCIImage:orientation:physicalWidth:alphaInfo:addPadding:]
You may notice that this method makes several calls to the function __ARLogGeneral, but after every call it seems IDA has failed to analyze the subsequent instructions:
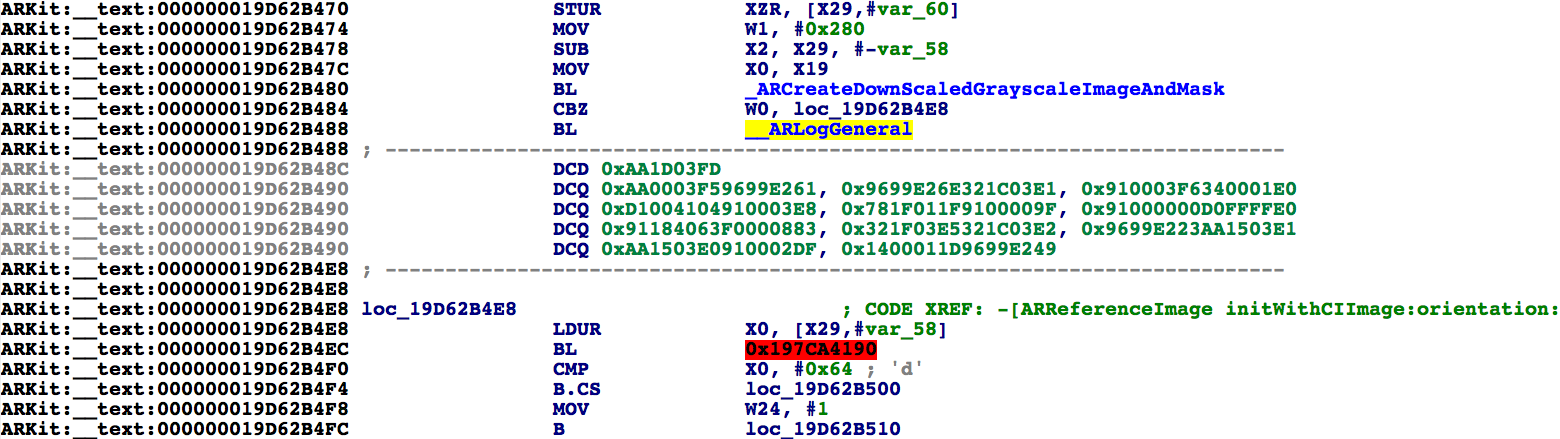
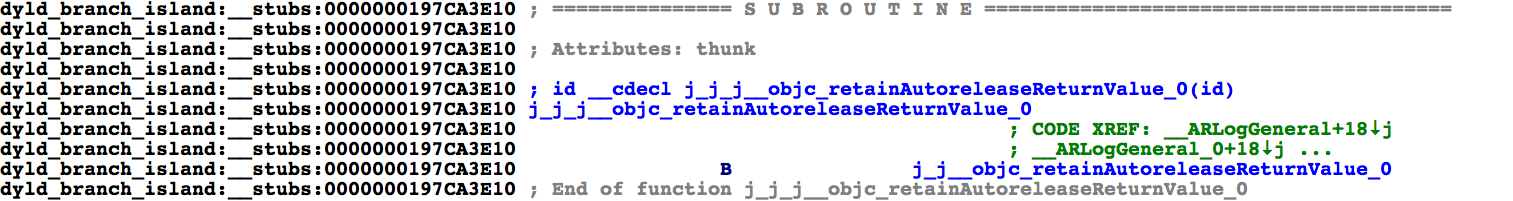
Note that the bytes in the range 19D62B48C..19D62B4E8 have not been disassembled. To understand why this happens, consider the analysis of __ARLogGeneral:
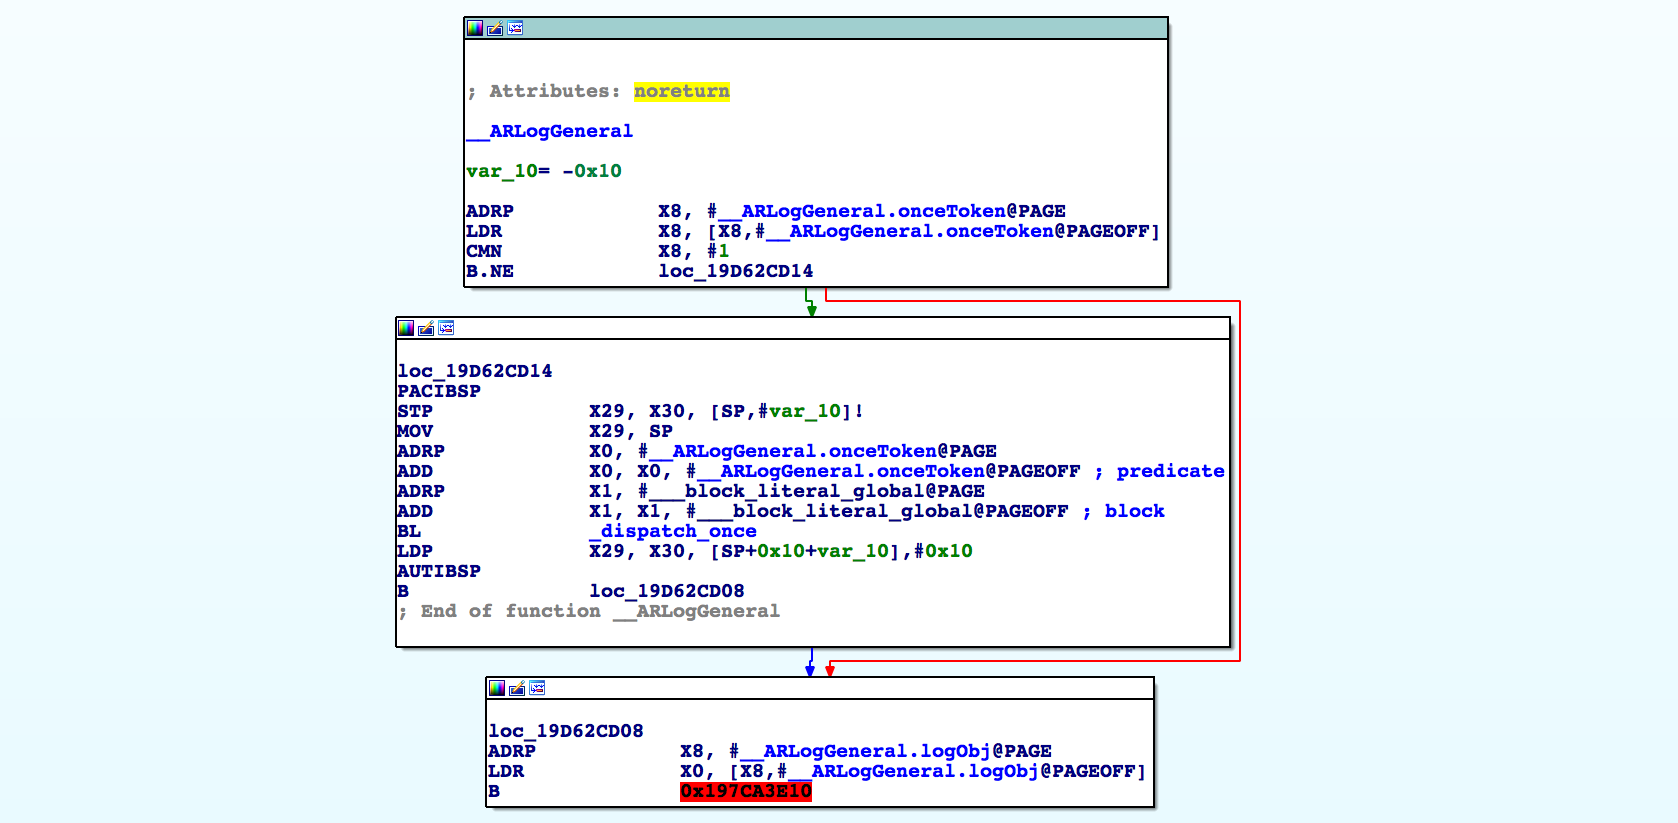
Immediately we notice a problem: IDA believes that this function does not return (note the line
Attributes: noreturn). This happens because the function performs a tail call, and the branch target
B
0x197CA3E10 points to a location outside of the ARKit module.
At this point IDA has lost track of the flow of the program. Naturally IDA does not assume that control will return to the caller of __ARLogGeneral after an absolute branch to an unknown address (even though in this specific case we
know it will). So it
looks like the call instruction at 19D62B488 will never return, and as a result some bytes are skipped.
This is an unfortunate side-effect of IDA trying to analyze incomplete code. We can likely improve the heuristics in IDA's analysis engine to handle this situation, but for now, what can we do about it?
Workaround
To repair the disassembly, we can use the following script. Copy it to your snippets window (Shift+F2) and execute it.
def repair_noret(name):
    ea = idaapi.get_name_ea(BADADDR, name)
    if ea != BADADDR:
        func = idaapi.get_func(ea)
        if func is not None and (func.flags & FUNC_NORET) != 0:
            func.flags &= ~FUNC_NORET
            idaapi.update_func(func)
            idaapi.reanalyze_callers(func.start_ea, False)
Now, whenever we find a function that IDA has misidentified as
noreturn we can invoke repair_noret():
Python>repair_noret("__ARLogGeneral")
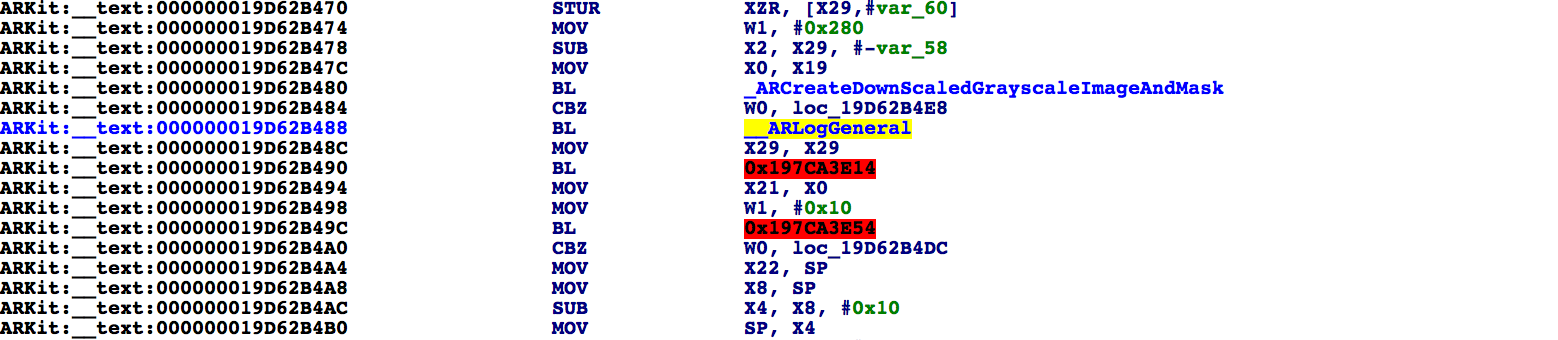
Go back to 19D62B488 and note that the instructions following
BL __ARLogGeneral are now properly disassembled:
For a more aggressive solution, you can disable the
noreturn attribute entirely when loading a new file:
# noret.py
# Usage: ida64 -Snoret.py dyld_shared_cache_arm64e
# This prevents IDA from creating functions with the noreturn attribute.
# In dyldcache modules it is common that IDA will think a function doesn't return,
# but in reality it just branches to an address outside of the current module.
# Such functions tend to frequently break the disassembly, so we disable them.
idaapi.cvar.inf.af &= ~AF_ANORET
Branch Islands
You may notice that ARKit doesn't directly invoke functions from other modules. Instead, most calls go through a sequence of branch stubs before arriving at the target function in a separate module. For example, consider the tail call
from __ARLogGeneral:
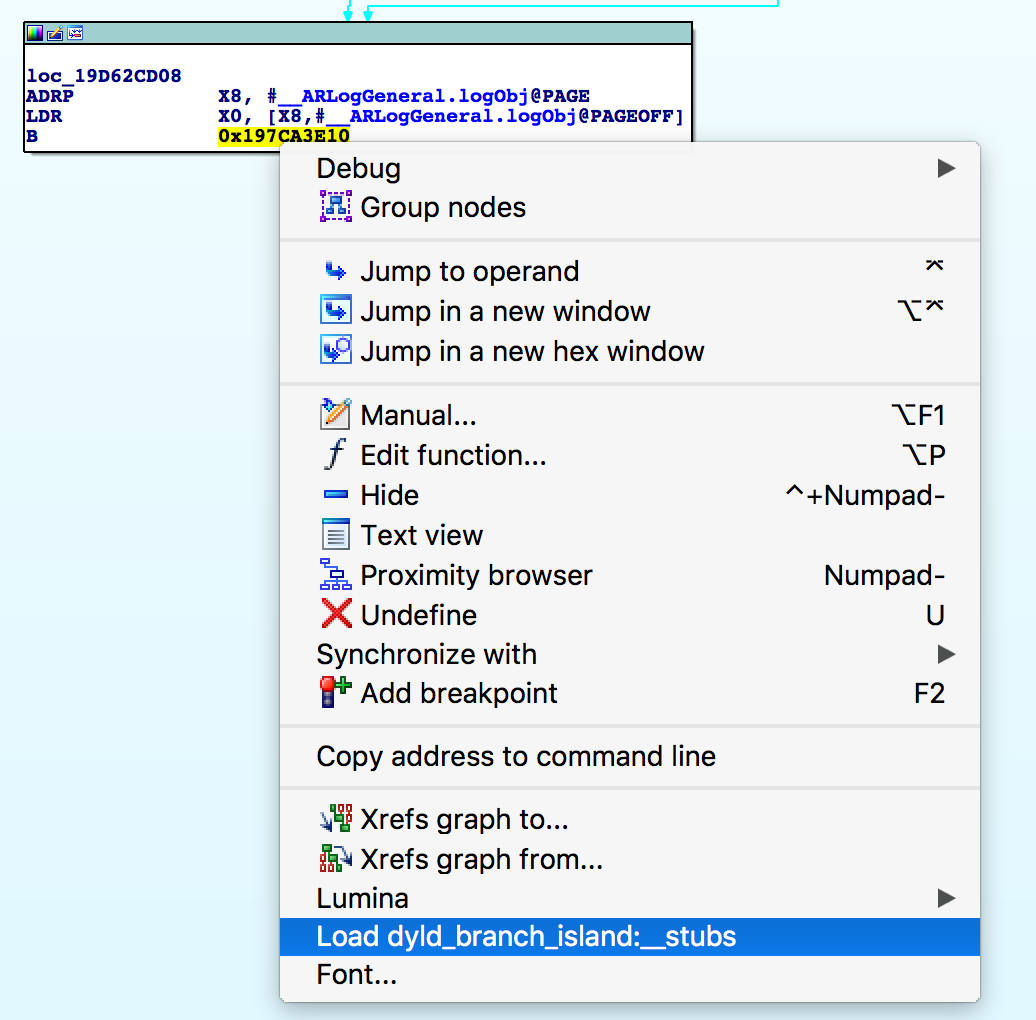
If we load the stubs, we see the code actually jumps through several stubs before finally branching to the target function in libobjc.dylib:

This is another annoyance of dyldcache analysis. It can be quite tedious to manually follow calls through 5+ stubs before finally discovering which function is actually being invoked. Moreover, the disassembly isn't very readable even
after all the stubs are loaded. Normally we expect to see a lot of instructions like
BL _objc_msgSend but instead we have
BL loc_197CA3E00 everywhere.
What can be done to improve the disassembly? It turns out that automating the dscu plugin can help immensely.
Scripting dscu
We have found that loading dyldcache modules from a script can yield much cleaner analysis. The general idea is to use
dscu to load the most critical parts of the cache into the database
before IDA
performs the autoanalysis. This allows the analysis to proceed more naturally, since IDA doesn't have to guess when resolving tricky situations like tail calls and branch stubs.
Already we've identified libobjc.dylib and several branch islands as important dependencies, but naturally there are more. If we spend some more time browsing the broken parts of the disassembly in ARKit, we can get a good sense of
which modules need to be loaded to get a clean analysis.
Then we can create the following script:
# ARKit.py
# dyldcache batch analysis script for the ARKit module from iPhone11,2_12.0_16A366_Restore.ipsw.
# Usage:
# $ IDA_DYLD_CACHE_MODULE=/System/Library/Frameworks/ARKit.framework/ARKit \
#   /Applications/IDA\ Pro\ 7.2/ida64.app/Contents/MacOS/idat64 \
#   -c -A \
#   -T"Apple DYLD cache for arm64e (single module)" \
#   -SARKit.py \
#   -oARKit.i64 \
#   -LARKit.log \
#   -Oobjc:+l \
#   dyld_shared_cache_arm64e

def dscu_load_module(module):
  node = idaapi.netnode()
  node.create("$ dscu")
  node.supset(2, module)
  load_and_run_plugin("dscu", 1)

def dscu_load_region(ea):
  node = idaapi.netnode()
  node.create("$ dscu")
  node.altset(3, ea)
  load_and_run_plugin("dscu", 2)

# load some branch islands used by ARKit
dscu_load_region(0x197CA3E10)
dscu_load_region(0x18FDE4678)
dscu_load_region(0x187EE73F4)

# load some commonly used system dylibs
dscu_load_module("/usr/lib/system/libsystem_c.dylib")
dscu_load_module("/usr/lib/system/libsystem_kernel.dylib")
dscu_load_module("/usr/lib/system/libsystem_trace.dylib")
dscu_load_module("/usr/lib/system/libsystem_blocks.dylib")
dscu_load_module("/usr/lib/libc++.1.dylib")

# load some essential frameworks used by ARKit
dscu_load_module("/System/Library/Frameworks/CoreVideo.framework/CoreVideo")
dscu_load_module("/System/Library/Frameworks/CoreMedia.framework/CoreMedia")
dscu_load_module("/System/Library/Frameworks/Accelerate.framework/Frameworks/vImage.framework/vImage")
dscu_load_module("/System/Library/PrivateFrameworks/CoreAppleCVA.framework/CoreAppleCVA")

# load the libobjc module
dscu_load_module("/usr/lib/libobjc.A.dylib")
# load common method selectors in UIKit:__objc_methname
dscu_load_region(0x1AECFFD00)
# analyze objc types
load_and_run_plugin("objc", 1)

# prevent IDA from creating functions with the noreturn attribute.
# in dyldcache modules it is common that IDA will think a function doesn't return,
# but in reality it just branches to an address outside of the current module.
# this can break the analysis at times.
idaapi.cvar.inf.af &= ~AF_ANORET

# perform autoanalysis
auto_mark_range(0, BADADDR, AU_FINAL);
auto_wait();

# close IDA and save the database
qexit(0)
First let's take a second to go over the command line arguments used to invoke the script:
- IDA_DYLD_CACHE_MODULE=/System/Library/Frameworks/ARKit.framework/ARKit
This environment variable instructs the macho loader to load the given module instead of asking the user to choose one
- /Applications/IDA Pro 7.2/ida64.app/Contents/MacOS/idat64
Path to idat64 in your IDA 7.2 installation
- -c -A
Run IDA in non-interactive mode, and overwrite any existing database
- -T"Apple DYLD cache for arm64e (single module)"
Instruct the macho loader to only load ARKit. We will load select dependencies ourselves
- -SARKit.py
Instruct IDA to run this script once ARKit is loaded
- -oARKit.i64
Name of the resulting database
- -LARKit.log
Dump the console output to a file for reference
- -Oobjc:+l
This will put the objc plugin in lazy mode, which will prevent it from automatically re-analyzing Objective-C types after each module is loaded. In our case we will be loading several modules in succession, so to save time we
disable the automatic analysis and invoke objc manually after all modules are loaded.
- dyld_shared_cache_arm64e
The target input file
Try running the command and wait for the script to complete (normally it should take less than 3 minutes). Once it's finished, we can open ARKit.i64 and start exploring the database. Immediately we see that the analysis is much
cleaner:
Note that the instructions following the call to __ARLogGeneral have been properly disassembled and the calls to
objc_retainAutoreleasedReturnValue and
os_log_type_enabled have been cleanly resolved,
despite the fact that they jump through multiple branch stubs. Also, function prototypes have been applied to the branch stubs which can be especially helpful:
This is another benefit of preemptively loading modules before the autoanalysis.
Browsing around the rest of the ARKit module, we see the analysis is more or less consistent with a standalone Mach-O file.
Recall that we only needed to load a handful of extra modules, which in total only took a few minutes to analyze and generated a database of manageable size. So essentially we've manufactured a custom load option somewhere in between
the
single module and
single module plus dependencies options offered by IDA.
Scripting dscu in such a way isn't always the most precise option. After all we're only loading the modules that "look important", but techniques for identifying dependencies can always be refined. What's most important is that
you
control the loading process, which should make a useful addition to your IDA toolbox.
MobileGestalt
Let's expand on this technique with one of the more popular internal iOS libraries:
libMobileGestalt.dylib.
This module is interesting because some of its functionality is implemented in an extension module,
libMobileGestaltExtensions.dylib.
libMobileGestalt does not link against this extension module, but rather loads it dynamically. Thus, IDA won't load the extension module even when using the
single module plus dependencies option. dscu allows us to
load it whenever we want.
The goal is to get some nice decompilation results for the two companion MobileGestalt modules. Let's see if we can make it happen:
# MobileGestalt.py
# dyldcache batch analysis script for libMobileGestalt.dylib from iPhone11,2_12.0_16A366_Restore.ipsw.
# Usage:
# $ IDA_DYLD_CACHE_MODULE=/usr/lib/libMobileGestalt.dylib \
#   /Applications/IDA\ Pro\ 7.2/ida64.app/Contents/MacOS/idat64 \
#   -c -A \
#   -T"Apple DYLD cache for arm64e (single module)" \
#   -SMobileGestalt.py \
#   -oMobileGestalt.i64 \
#   -LMobileGestalt.log \
#   -Oobjc:+l \
#   dyld_shared_cache_arm64e

def dscu_load_module(module):
  node = idaapi.netnode()
  node.create("$ dscu")
  node.supset(2, module)
  load_and_run_plugin("dscu", 1)

def dscu_load_region(ea):
  node = idaapi.netnode()
  node.create("$ dscu")
  node.altset(3, ea)
  load_and_run_plugin("dscu", 2)

# load some core dylibs (there are more, but these seem to be most important)
dscu_load_module("/usr/lib/system/libsystem_kernel.dylib")
dscu_load_module("/usr/lib/system/libsystem_c.dylib")
dscu_load_module("/usr/lib/system/libsystem_blocks.dylib")
dscu_load_module("/usr/lib/system/libsystem_trace.dylib")
dscu_load_module("/usr/lib/system/libsystem_pthread.dylib")
dscu_load_module("/usr/lib/system/libdyld.dylib")

# load some essential frameworks
dscu_load_module("/System/Library/Frameworks/IOKit.framework/Versions/A/IOKit")
dscu_load_module("/System/Library/Frameworks/CoreFoundation.framework/CoreFoundation")

# load the MobileGestalt extension module
dscu_load_module("/usr/lib/libMobileGestaltExtensions.dylib")

# the extension module uses a lot of branch islands, load them
dscu_load_region(0x1A79FCF08)
dscu_load_region(0x19FB04C78)
dscu_load_region(0x197CA3E08)
dscu_load_region(0x18FDE4678)
dscu_load_region(0x187EE73EC)

# extension module is objc heavy, better load some core objc stuff
dscu_load_module("/usr/lib/libobjc.A.dylib")
# load method selectors from UIKit:__objc_methname
dscu_load_region(0x1AED00FA6)

# analyze objc segments
load_and_run_plugin("objc", 1)
# analyze NSConcreteGlobalBlock objects
load_and_run_plugin("objc", 4)

# prevent IDA from creating functions with the noreturn attribute.
# in dyldcache modules it is common that IDA will think a function doesn't return,
# but in reality it just branches to an address outside of the current module.
# this can break the analysis at times.
idaapi.cvar.inf.af &= ~AF_ANORET

# perform autoanalysis
auto_mark_range(0, BADADDR, AU_FINAL);
auto_wait();

# analyze NSConcreteStackBlock objects (a NOP if you don't have the decompiler)
load_and_run_plugin("objc", 5)

# close IDA and save the database
qexit(0)
Try running this script. It should take about 2 minutes to finish, and creates a rich but still modestly sized database in MobileGestalt.i64. As a sanity check let's open this database and go to the first xref to _dlopen at 18142C75C.
Sure enough this is where we find the lazy loading of the extension module:
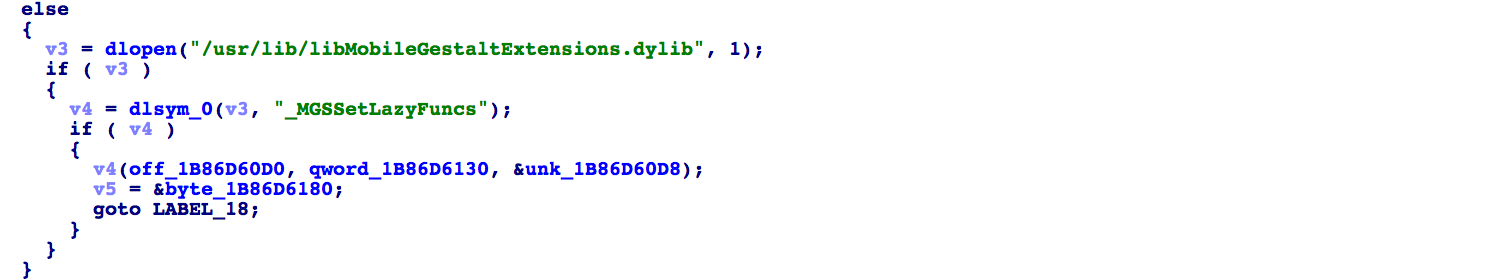
Immediately we see a call to __MGSSetLazyFuncs in the extension module, which simply populates an array of function pointers from libMobileGestaltExtensions:__auth_ptr. Let's try decompiling one of these lazy funcs at 1AA36E470. This
one is interesting because it's a little more Objective-C heavy:
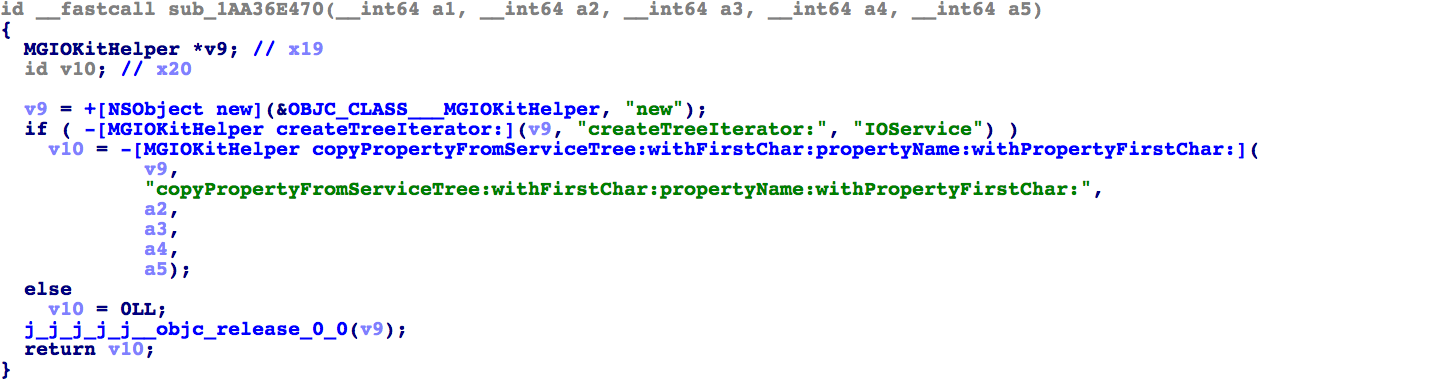
On the surface the pseudocode looks quite clean, but it's worth discussing what's going on under the hood. Try disabling the objc plugin with
Edit>Other>Objective-C>Objective-C Options..., uncheck
Enable
decompiler plugin for Objective-C, and refresh the pseudocode with F5:
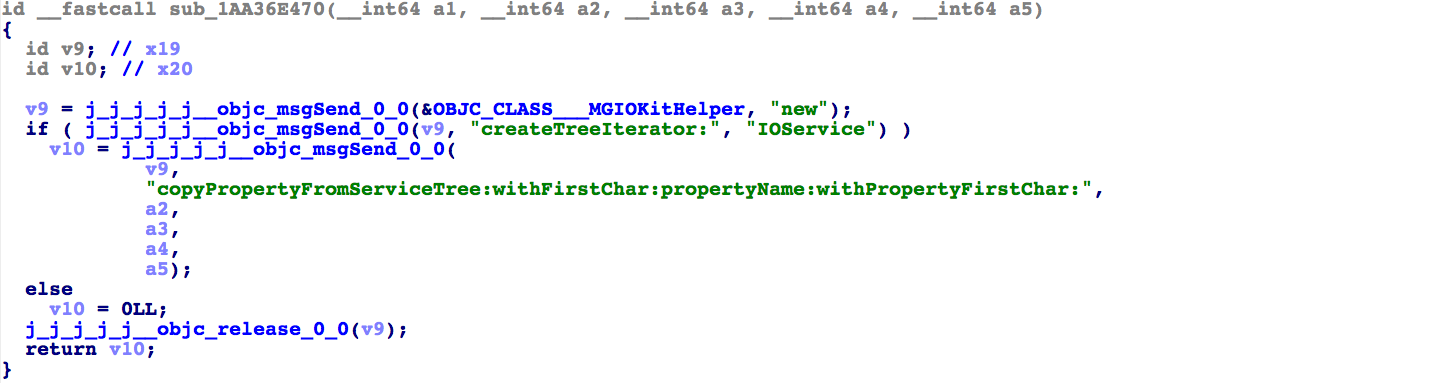
Note how the objc plugin simplified the calls to objc_msgSend. Also note that the code doesn't call the
real objc_msgSend in libobjc, but instead calls the first branch in a long sequence of branches to libobjc. There are
likely several of these variations of objc_msgSend in the database, and it is important that objc keeps track of all of them.
You can print all known variations of important objc runtime functions with:
IDC>load_and_run_plugin("objc", 7)
OBJC: 1800BF000: _objc_msgSend_0
OBJC: 180AD9D90: _objc_msgSend
OBJC: 180F0BCE0: j__objc_msgSend
OBJC: 187EE73E0: j__objc_msgSend_0_0
OBJC: 18FDE466C: j_j__objc_msgSend_0_0
OBJC: 197CA3DFC: j_j_j__objc_msgSend_0_0
OBJC: 19FB04C6C: j_j_j_j__objc_msgSend_0_0
OBJC: 1A79FCE38: j_j_j_j_j__objc_msgSend_0_0
OBJC: 1AA3756C4: j__objc_msgSend_0
objc will add to this list if a name with the pattern
[j_]*objc_msgSend[0-9_]* is added to the database.
This is another important reason why we preemptively loaded all the branch islands, so the list is populated automatically during autoanalysis. If a variation of objc_msgSend does not appear in this list, then it will not be
simplified by objc during decompilation. This is something to keep in mind if you regularly decompile Objective-C code from dyldcache files.
Blocks
Note that in MobileGestalt.py we added the lines:
# analyze NSConcreteGlobalBlock objects
load_and_run_plugin("objc", 4)
...
# analyze NSConcreteStackBlock objects
load_and_run_plugin("objc", 5)
The MobileGestalt modules use a fair amount of block functions, so analyzing them likely cleaned up some important logic.
To get a sense of how the block analysis affects the database, enable
Edit>Other>Objective-C>Objective-C Options>Verbose mode and run:
IDC>load_and_run_plugin("objc", 6)
OBJC: NSConcreteGlobalBlock: 293/293 blocks successfully analyzed
OBJC: NSConcreteGlobalBlock: isa refs:
OBJC:   1B16DD198 __NSConcreteGlobalBlock_ptr
OBJC:   1BAAFE5E0 __NSConcreteGlobalBlock
OBJC: NSConcreteGlobalBlock: block analysis succeeded at:
OBJC:   1B175AB88
OBJC:   1B175ABC8
OBJC:   1B175AC08
...
OBJC: NSConcreteStackBlock: 628/638 blocks successfully analyzed
OBJC: NSConcreteStackBlock: isa refs:
OBJC:   1B168D638 __NSConcreteStackBlock_ptr_5
OBJC:   1B16A6538 __NSConcreteStackBlock_ptr_1
OBJC:   1B16AA958 __NSConcreteStackBlock_ptr
OBJC:   1B16B5E90 __NSConcreteStackBlock_ptr_0
...
OBJC: NSConcreteStackBlock: block analysis succeeded at:
OBJC:   1814288A4
OBJC:   181428B50
OBJC:   18142B164
...
For more on block analysis, check out the objc
Help page.
Conclusion
The MobileGestalt.py analysis script was an apparent success, judging by the clarity of the pseudocode we've seen so far from libMobileGestalt and libMobileGestaltExtensions. It is likely that this database will help uncover some
interesting iOS internals.
The completion of
that task is left as an exercise for the reader :)
iOS Debugger + dyld
With the introduction of dyld-625 and the ARM64e architecture in iOS 12, Apple's dynamic linker has made some significant security-related upgrades. This, combined with the fact that (as of this writing) the dyld-625 source code
hasn't been released yet, has made dyld an area of particular interest to reverse engineers.
In this example we will use IDA to
debug dyld itself, focusing on the logic that uses
ARMv8.3-A PAC instructions to perform
secure symbol bindings. Along the way we'll highlight some recent improvements to the debugger that have made this task a bit easier.
Setup
If this is your first experience with iOS debugging, check out our
primer. If not, start by reviewing the environment used in this example:
- Device: iPhone XS with iOS 12.1
- Application: a trivial arm64e helloworld app
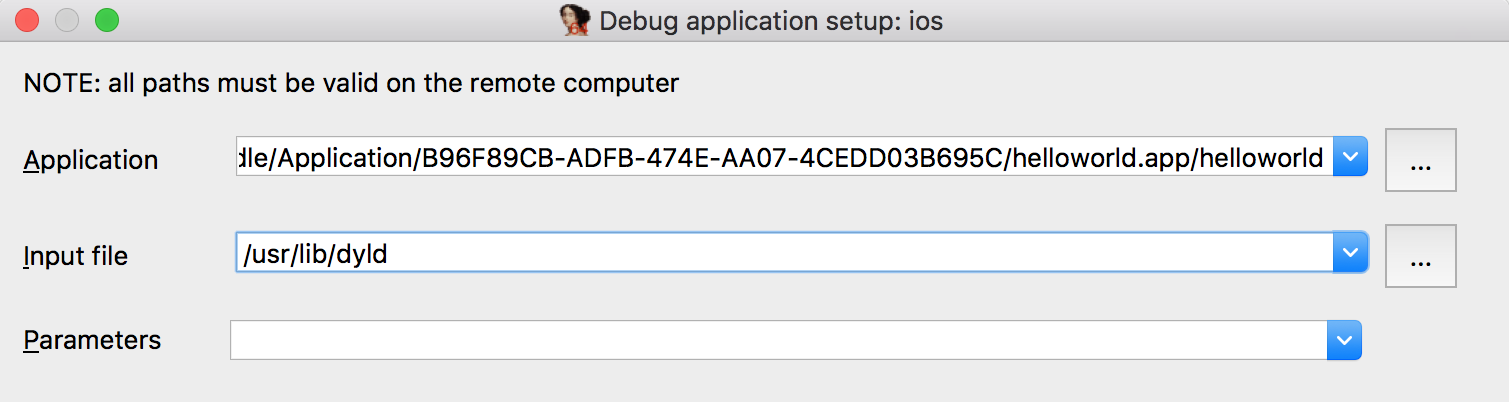
- Input file: dyld binary, copied from ~/Library/Developer/Xcode/iOS DeviceSupport/12.1 (16B92)/Symbols/usr/lib/dyld
Load the dyld binary in IDA, and set the following fields in
Debugger>Process Options...
Now open
Debugger>Debugger options... and enable
Suspend on debugging start. This will suspend the process at dyld's entry point, before it has begun binding symbols. We're now ready to start
debugging dyld - but first let's make note of some important changes between IDA 7.1 and 7.2.
IDA 7.1
In previous versions of IDA, you may have noticed this message when launching the iOS Debugger:
FFFFFFFFFFFFFFFF: process /var/containers/Bundle/Application/<UUID>/helloworld.app/helloworld has started
This denotes the
PROCESS_STARTED event, which typically advertises the base address of the executable module at debugging start. However in the iOS Debugger, the base address was unknown due to ASLR. IDA couldn't
immediately detect where the executable was loaded, and relied on dyld to notify us of the exe base. Later on we would see:
1000D8000: loaded /var/containers/Bundle/Application/<UUID>/helloworld.app/helloworld
which denotes a
LIB_LOADED event for the executable with the correct base address. Thus, the PROCESS_STARTED event acted as a placeholder until the LIB_LOADED event would come along and fix everything. In most cases
this was acceptable, but when using
Suspend on debugging start the situation was completely broken.
In this case the process is suspended before dyld can notify IDA of the loaded images, so IDA would have no clue where to find the executable module in memory - a bit of a drawback. Fortunately this has been fixed in IDA 7.2.
IDA 7.2
Let's return to our new IDA 7.2 database and launch the debugger. Right away we should see that the process is suspended at __dyld_start, and both dyld and the executable module have been identified in process memory:
1004E8000: loaded /usr/lib/dyld
100120000: process /var/containers/Bundle/Application/<UUID>/helloworld.app/helloworld has started
Note that since the PROCESS_STARTED event is now correct, there will be no LIB_LOADED event for the executable. This is something to keep in mind if you have plugins or scripts that hook to debugger events.
auth_stubs
Now that we have a correct debugging environment, let's try some actual debugging! Open the Modules window, right-click on the executable and select
Analyze module. Navigating to _main we see some simple logic that
prints out a message:
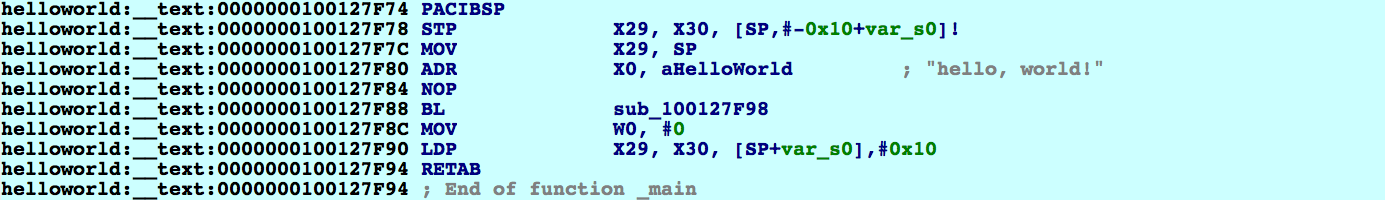
Let's take a look at sub_100127F98, which is the function stub for _puts. However it doesn't look like the stubs we're used to seeing:

The stub reads a pointer from off_10012800 and performs a branch with pointer authentication. We can assume that at some point, off_10012800 is filled with a signed pointer to _puts. It would be interesting to discover where this
pointer comes from to get a sense of when and how the binding is performed within dyld.
Watchpoints
IDA 7.2 officially added support for watchpoints in the iOS Debugger. This is an ideal time to use one:
IDC>add_bpt(0x100128000, 8, BPT_WRITE)
Resume the process and wait for dyld to hit our watchpoint in ImageLoaderMachO::bindLocation:

Note that despite dyld's extensive use of PAC to secure the return addresses on the stack, IDA can still extract a clean stack trace:
Address     Module   Function
100502AAC   dyld     ImageLoaderMachO::bindLocation
100507EE4   dyld     __ZN26ImageLoaderMachOCompressed6doBindERKN11ImageLoader11LinkContextEb_block_invoke
100507574   dyld     ImageLoaderMachOCompressed::eachBind
100506F2C   dyld     ImageLoaderMachOCompressed::doBind
1004FDAF0   dyld     ImageLoader::recursiveBind
1004FDA08   dyld     ImageLoader::recursiveBindWithAccounting
1004EF718   dyld     dyld::_main
1004E9040   dyld     __dyld_start
The process is currently stopped at 100502AAC, but it was the previous instruction
STR X20, [X19] that triggered our watchpoint - where X19=10012800 and X20=63388180C36124. Where did this magic value in X20 come from?
Let's use the decompiler to unravel the logic that generated it.
Pointer Authentication
In the pseudocode we can see that X20 maps to a local variable v18, and earlier in the code we see:

This function looks important, but surprisingly the decompiler thinks it doesn't do anything except return:

This is because its logic is comprised of mostly PAC instructions, which by default are simplified away by the decompiler (and it clearly does a good job of that). To see this logic in the pseudocode, enable
Edit>Plugins>Hex-Rays
Decompiler>Options>Analysis options>Show ARMv8.3 PAC instructions:
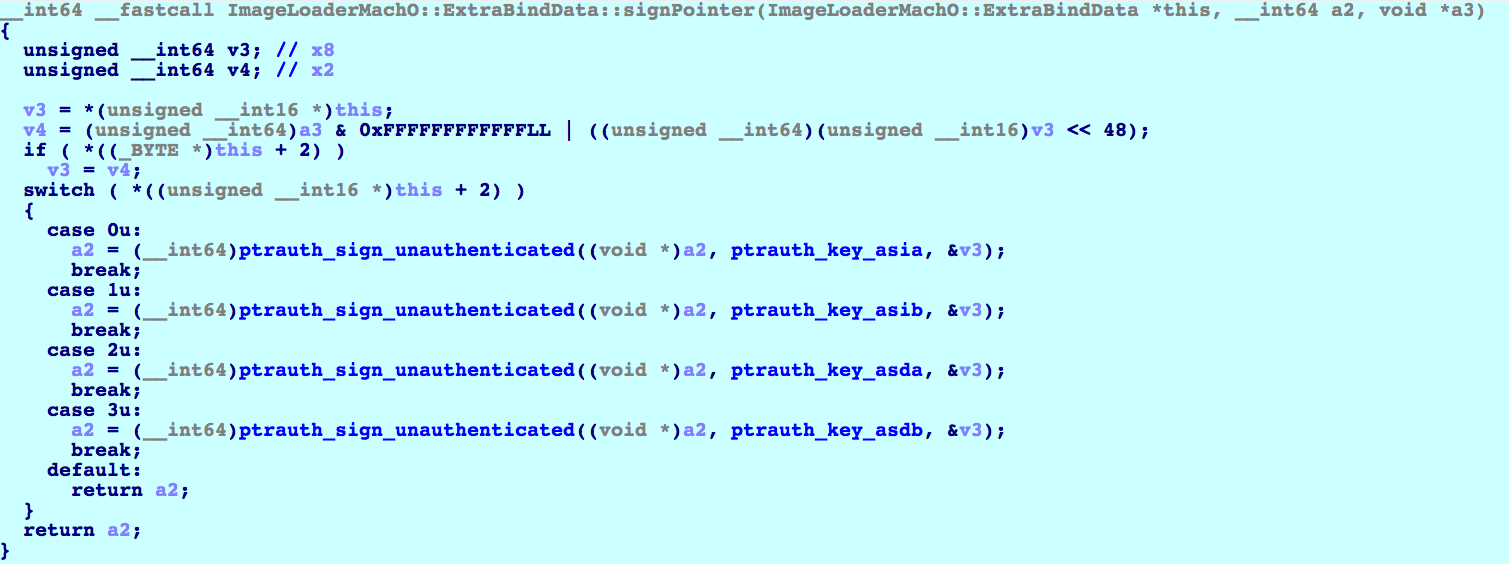
Note that the PAC* instructions are represented with the macro
ptrauth_sign_authenticated in the pseudocode. This macro and other ptrauth-related intrinsics are documented in
ptrauth.h in the
XcodeDefault.xctoolchain for Xcode 10.
These are the values ultimately used to calculate the signed pointer:

Thus, the address of _puts is tagged using the destination address in helloworld:__auth_got as the context value. This is quite clever, since the context is subject to ASLR (and therefore can't be guessed), but at this point the
executable has already been loaded into memory - so it won't change by the time the pointer is verified in __auth_stubs.
Now use F4 to run to
BRAA X16, X17 in sub_100127F98, and note the values of the operands:

Stepping over BRAA...

And there you have it, the complete lifecycle of a secure symbol binding in dyld for ARM64e. Fascinating!
Hopefully we've shown it is easy enough to use IDA to track down some critical logic in dyld. The logic isn't exactly mind-blowing, but dyld undoubtedly has some juicier secrets and it's likely IDA can help uncover them.
