Adding Dynamic Analysis to IDA
In addition to being a disassembler, IDA is also a powerful and versatile debugger. It supports multiple debugging targets and can handle remote applications, via a “remote debugging server”.
Overview
Debugging files on the three platforms IDA natively runs on (i.e., Windows, Linux, Mac OS X) is straightforward, and thanks to the power of remote debugging servers, it is possible to enable debugging of any executable, from any platform!
Look at how easy we’ve made it:
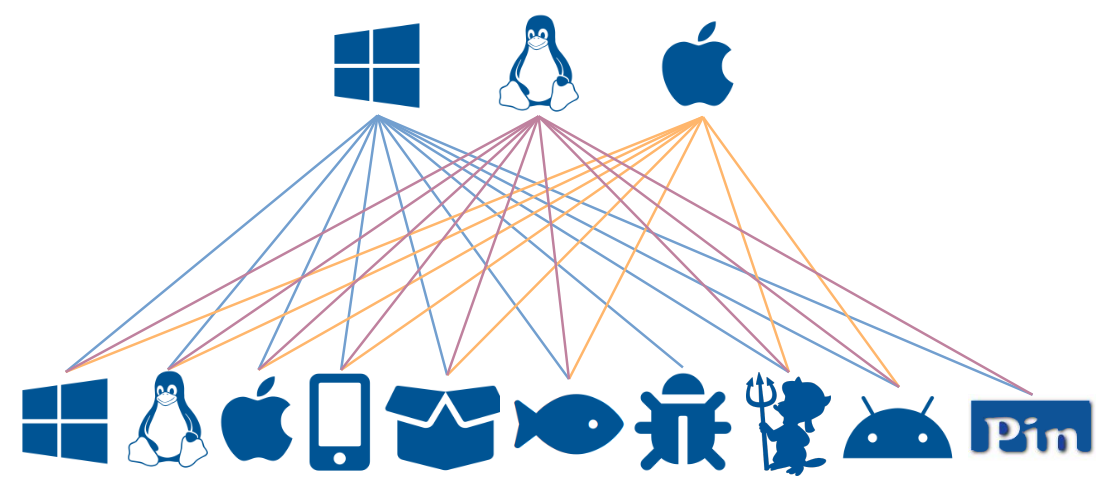
There! How’s that for simplicity: from anywhere, you can debug anything!
You can be sitting at a Mac OS X machine, and get to debug Windows programs on another machine – or even in a virtual machine (that’s actually how we enable kernel debugging. See details below!)
This, of course, is just an overview. Below, you will find a detailed table describing exactly what is supported, as well as some additional notes.
Cross-Platform Debugging Is Powerful!
IDA’s Cross-Platform debugging features these characteristics:
- Instant debugging, no need to wait for the analysis to be complete to start a debug session.
- Easy connection to both local and remote processes.
- Support for 64 bits systems and new connection possibilities.
Detailed Debugging Capabilities
Here are more details on how to debug specific platforms, from other platforms:
|
IDA runs on Windows |
IDA runs on Linux |
IDA runs on Mac OS X |
Additional Notes | |
|---|---|---|---|---|
|
Target Platform: Windows 32/64-bit |
Local/Remote | Remote | Remote | On 32-bit Windows platforms, remote only. |
|
Target Platform: Linux 32/64-bit |
Remote | Local/Remote | Remote |
On 32-bit Linux platforms, remote only. Supported platforms: x86/x64/ARM32 Linux/ARM Android |
|
Target Platform: OS X x86/x64 |
Remote | Remote | Local/Remote | On 32-bit Mac OS X platforms, remote only. |
|
Target Platform: iOS (iPhone and iPad) |
Remote | Remote | Remote | Supports remote debugging applications on iOS >= 9.0 and iPadOS >= 13.1, via Apple’s debugserver |
|
Target Platform: XNU |
Remote | Remote | Remote | Darwin kernel debugger. OSX kernel mode debugging is supported via the builtin gdb stub for VMware Fusion (EFI firmware debugging is also supported). iOS kernel mode debugging supported via Corellium and ktrw. |
|
Target Platform: Bochs |
Bochs Emulator | Bochs Emulator | Bochs Emulator | |
|
Target Platform: GDB Server |
GDB Server | GDB Server | GDB Server |
Debugger based on GDB Server.
Particularly useful for
windows or
linux
kernel debugging via VMWare, or even
QEMU-based debugging.
Currently (IDA 7.4) supported processors: x86/x64, ARM/AArch64, PowerPC, MIPS, Motorola 68k, Infineon TriCore, and Renesas RH850. |
|
Target Platform: WinDBG 32/64-bit |
Remote | / | / |
Both user-mode and
kernel-mode
debugging are available.
64-bit debugging is supported too.
See the help page
This debugger is available only for the Windows version of IDA Pro |
|
Target Platform: Intel PIN  |
Local | Local | / | Based on Intel PIN. Especially useful for tracing but can be used as a regular debugger too. |
|
Target Platform: Android (Dalvik) |
Remote | Remote | Remote | Both DEX bytecode and source level debugging are available. Please note that our Linux debugger can handle native code as well. |
Notes
- All debuggers are scriptable. For more information, check out this page
- Remote debugging tutorial is available here
- iPhone v1.x debugger is discontinued in IDA v5.6
- Bochs debugger is available under Linux and Mac OS X starting from IDA v5.7
Tutorials
We have written many tutorials to help get you started using the debuggers:
- Using IDA’s debugger under windows.
- Debugging on a Windows machine.
- Debugging on a Linux machine.
- Debugging a Linux executable from a Windows machine.
- Debugging a Windows executable from a Linux machine.
- Debugging a Windows 32-bit executable from another Windows 32-bit machine.
- Debugging a Windows 64-bit executable from a Windows 32-bit machine.
- Debugging a Windows 64-bit executable from a Linux machine.
- Debugging a Linux executable from another Linux machine.
- Using IDA’s debugger under Mac OS X. Also get the related zip file.
- XNU debugger tutorial.
- Debugging Windows applications with the Bochs debugger plugin.
- Debugging Windows applications with the Bochs debugger plugin under Unix.
- Using IDA’s GDB Server plugin with QEMU.
- Using IDA’s GDB Server plugin with VMWare: Debugging the Linux Kernel.
- Using IDA’s GDB Server plugin with VMWare: Debugging the Windows Kernel.
- Debugging Windows applications with IDA’s WinDBG plugin.
- Windows debugging is available since IDA 4.3.
- Linux debugging is available since IDA 4.7.
- Debugging Dalvik applications.
- Debugging iOS/iPhone applications.